Over the summer, Stamen was joined by Zoe Padgett, an intern studying a Masters of Fine Arts in Media Design Practices from the Art Center College of Design. We were delighted to have her join us, and all tickled by the work you see below.
My first week at Stamen, Art Director George Oates gave me a seemingly simple assignment. “I want you to visualize Stamen,” she said. Initially I was delighted. That’s why I begged to intern here in the first place — because of the exciting and beautiful data visualizations I saw this company produced. I wanted to be a part of it. I thought this was my first step onto the pitch.
At first, I felt shy and unsure. The only thing I was absolutely sure of was that Stamen loved plants. Plant visualizations? Somewhat cliché for a company named after a flower’s penis. I walked timidly through the office. There seemed to be some rooms dedicated to relaxation. In others, you could almost feel the python syntax being pumped into hard drives. Intense. I headed for the kitchen. Upon examination, it appeared Stamen loved chocolate; kettle chips and had a sizable liquor collection. Ok, well there’s an idea. What else, I thought. I went onto stamen.com. I read all of the employee bios. I read the company description and past and present client lists. I took notes, did sketches, and ultimately produced my first round of “Visualizing Stamen” pieces.
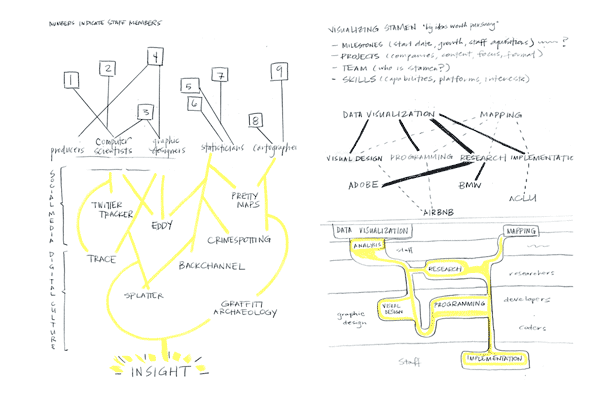
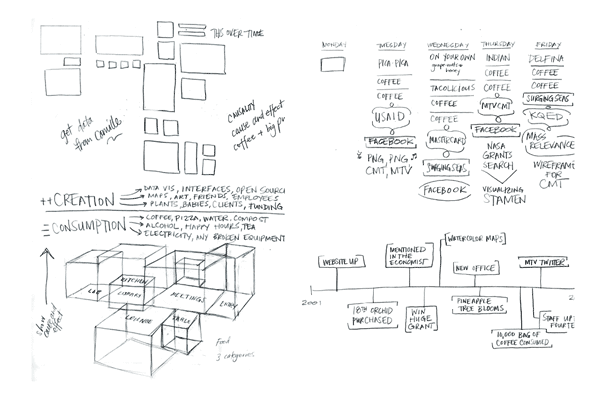
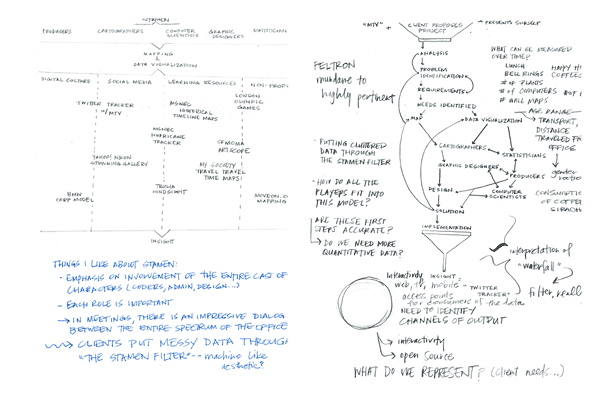
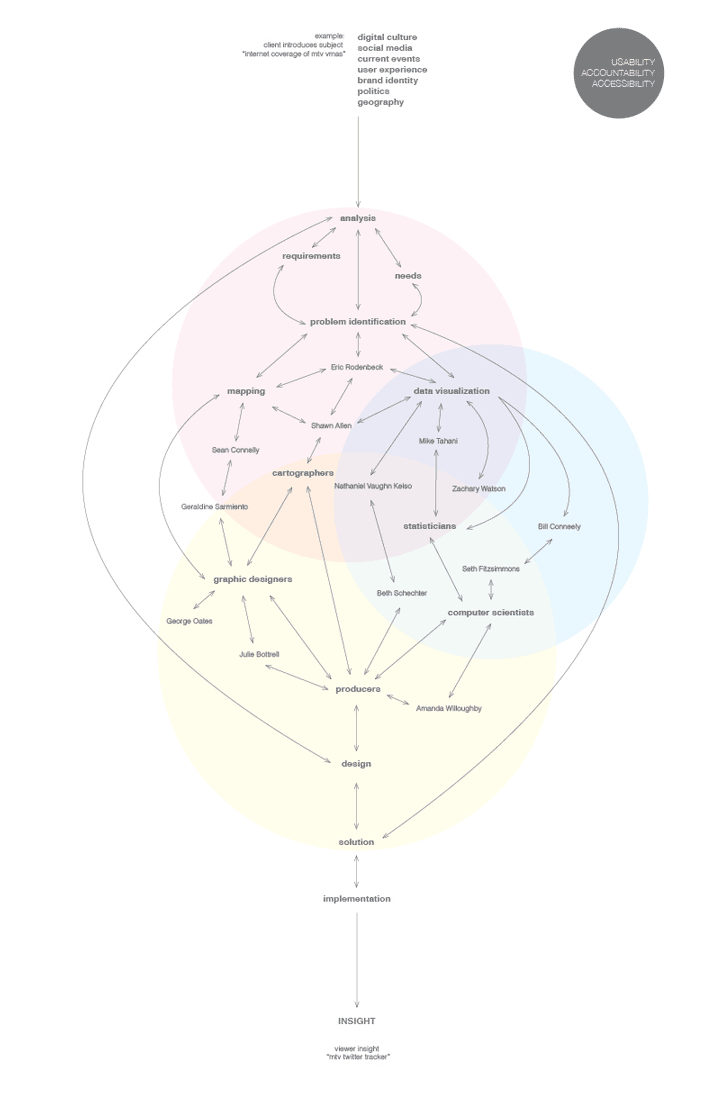
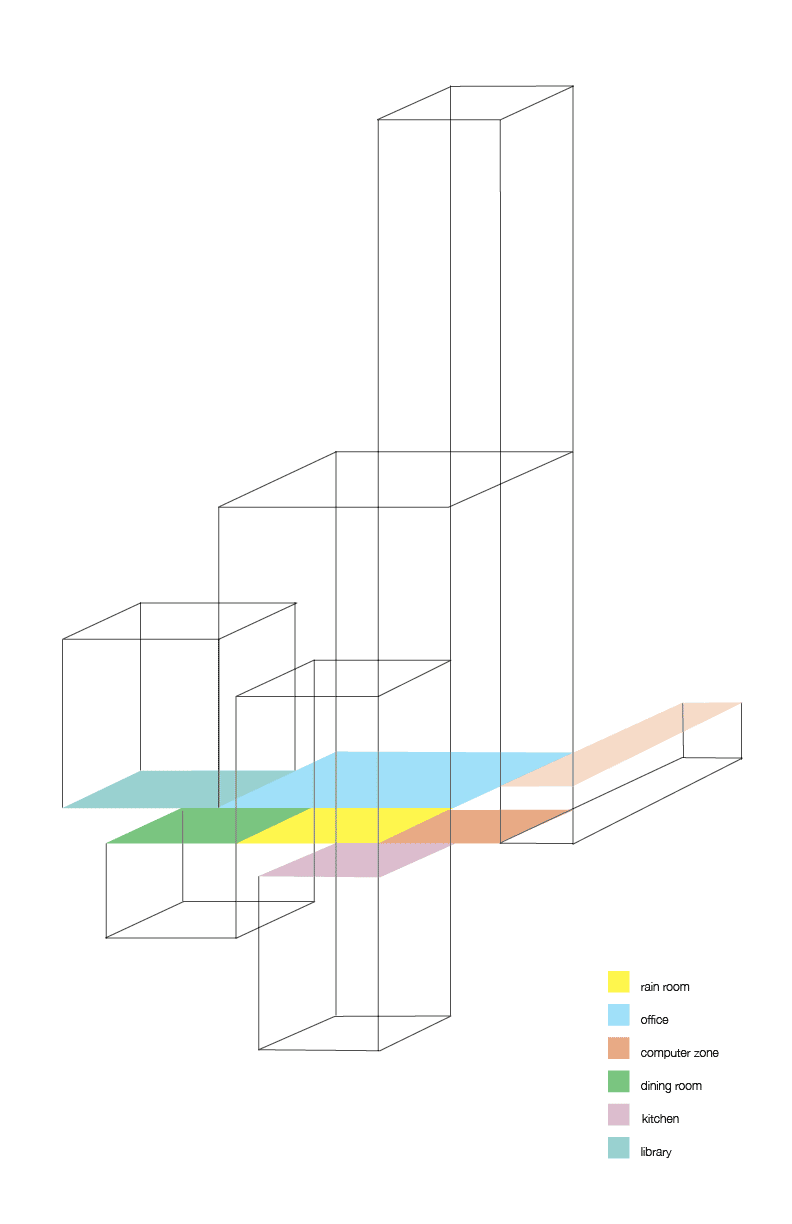
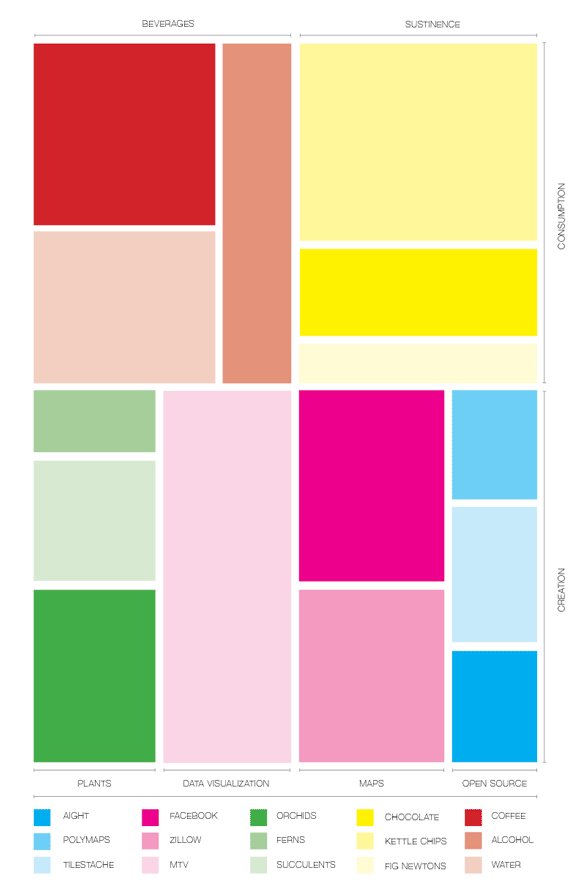
I presented these nervously in front of the office. The response was polite and encouraging. But, I felt somewhat silly. Out in the coding zone, the developers were producing interactive pieces about the degradation of the Chesapeake Bay. Here I was trying to tell them how much chocolate they eat. George suggested interviewing each member of the staff. I drafted up a form I titled “The Stamen Insight Questionnaire” and sent it around the office. The form asked about people’s birthplaces, current living situation, transport use and education. I think George thought I was trying to steal everyone’s identity, as she politely declined to tell me where she lives. The response to the form was less than enthusiastic, but after about three weeks I was able to get everyone to fill it out. It was an exciting new data set and it allowed me to dig a little deeper.
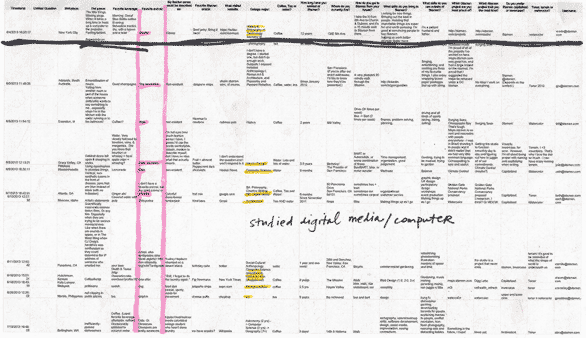
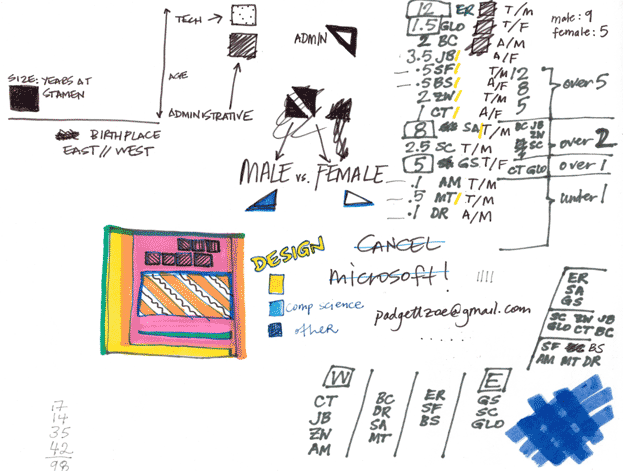
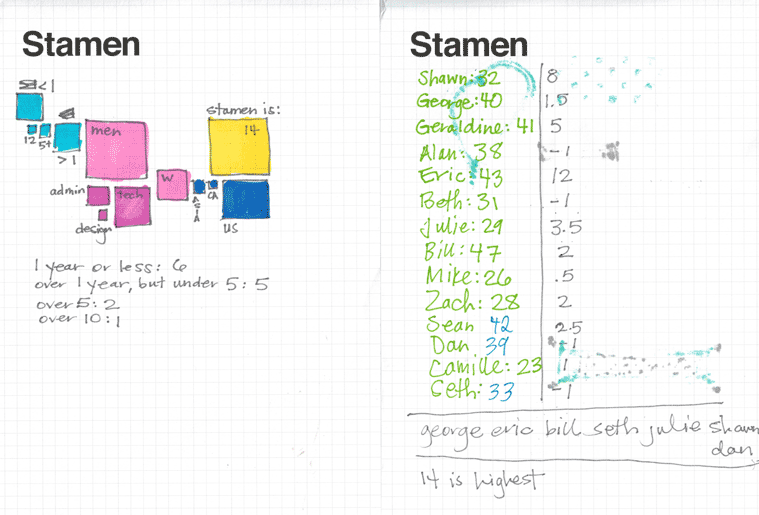
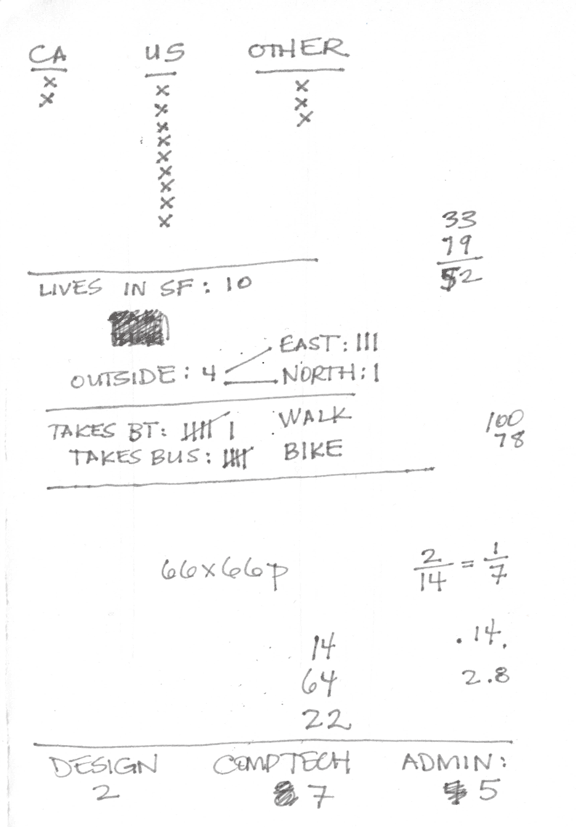
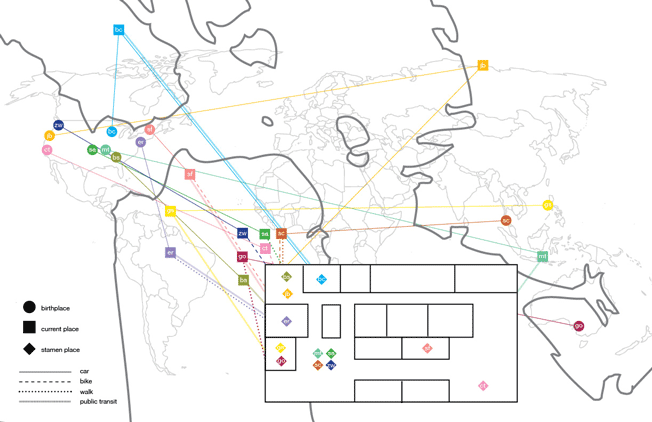
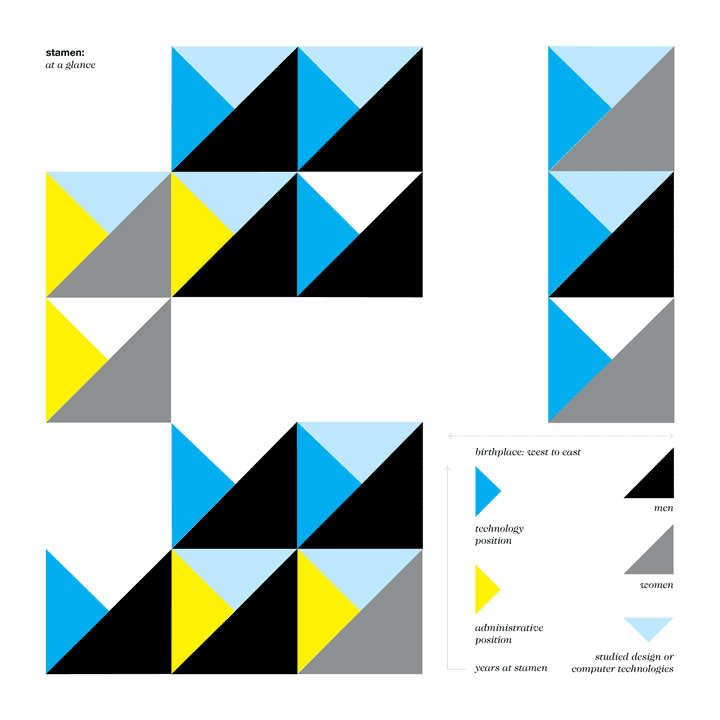
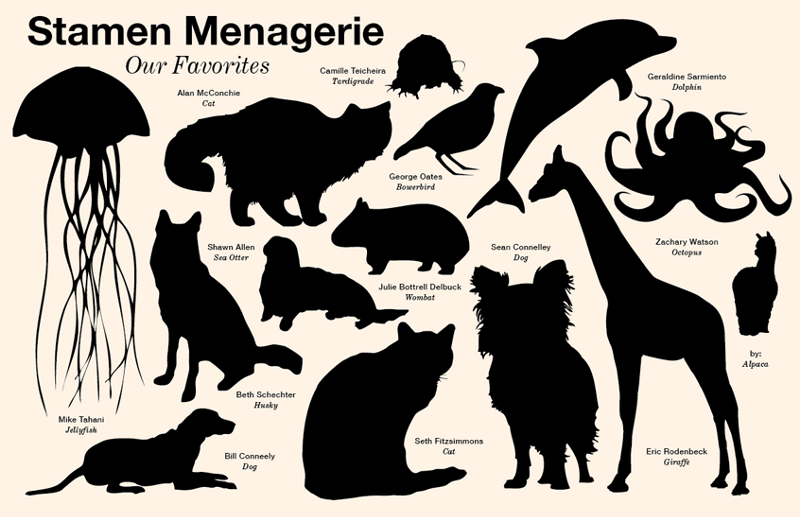
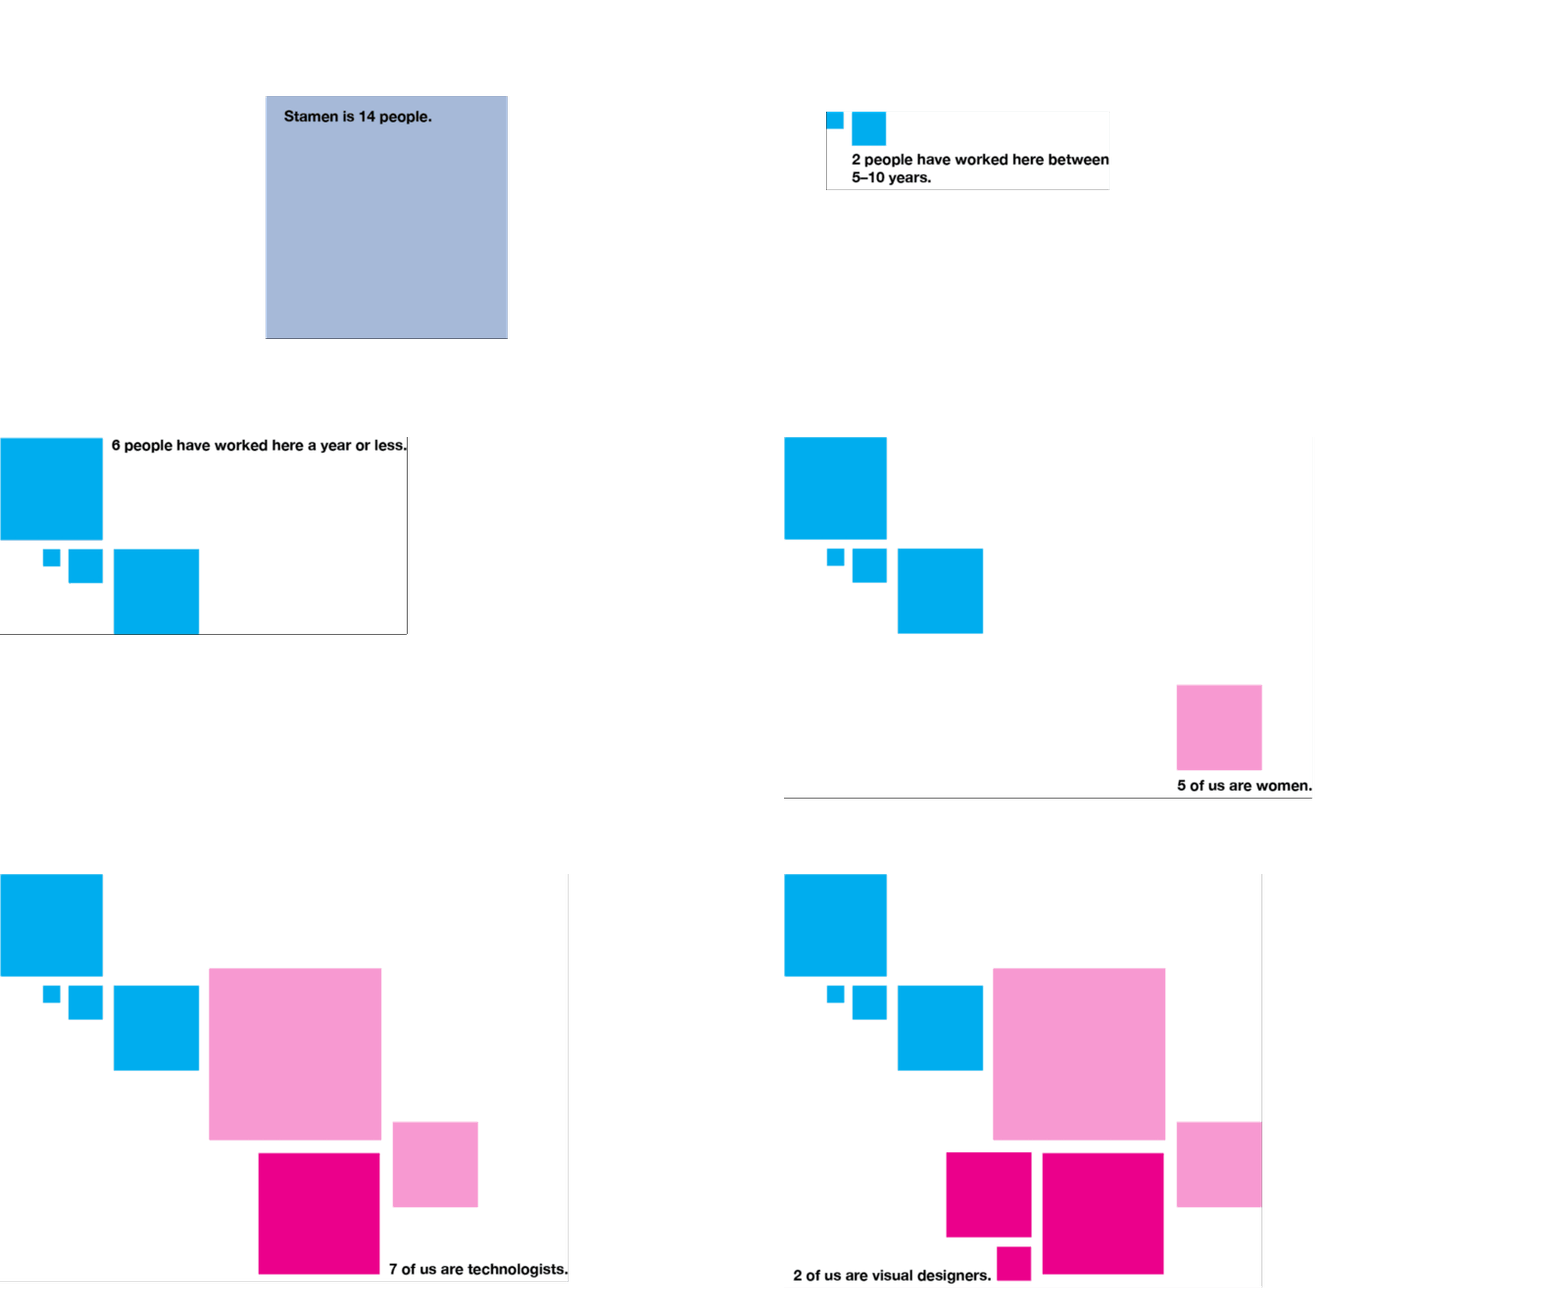
At this point, I had started to understand the staff and the company a bit more in depth. As I grew to know the employees better, many things started to become apparent about the company. Stamen is an incredibly respected company,and it has delighted minds across the world. It is a company that started doing data visualization before anyone had even uttered the word “infographic” (a word I would later understand as blasphemous in this office). The company takes care of its employees generously and treats them with respect. It was also clear that the company was in a bit of flux. Close to half the staff had been hired within the last year and we were in transition between managers. The elder Stamens were few and far between. Are we ushering in a new era of Stamen? I had to delve deeper to find out.
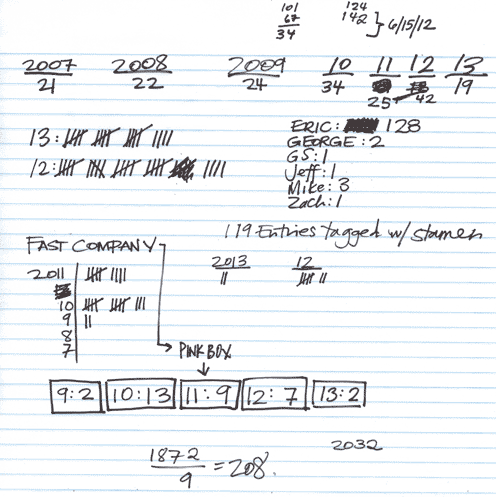
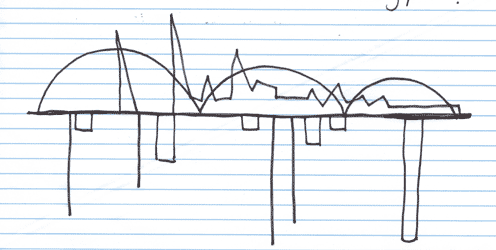
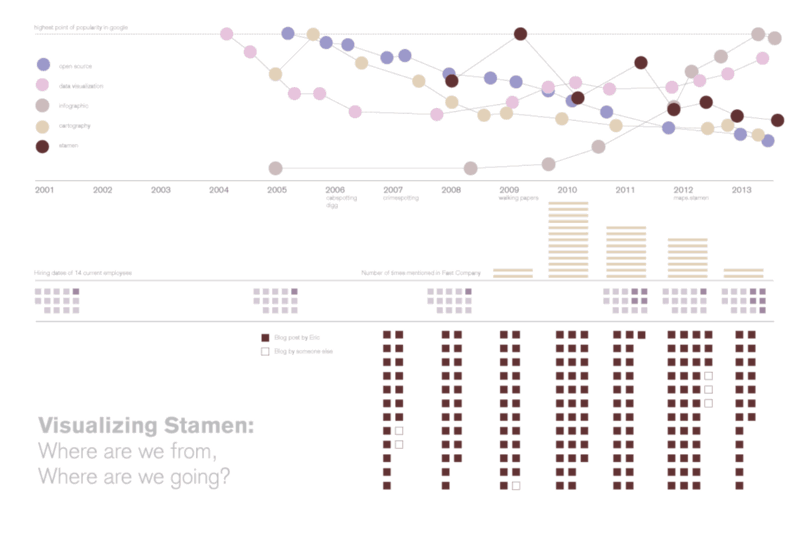
Stamen is a maverick company and is jam packed with the most talented, funny, and insightful people. Its essence lies in its tagline: “The next most obvious thing.” As I leave Stamen, I know my legacy will be a indeterminate blip in the history of a truly great company. But, I can’t help but ask a question back: Stamen, what’s the next most obvious thing?
Best of luck, Zoe!
