
Fundamental shifts are underway in the relationship between San Francisco and Silicon Valley.
Historically, workers have lived in residential suburbs while commuting to work in the city. For Silicon Valley, however, the situation is reversed: many of the largest technology companies are based in suburbs, but look to recruit younger knowledge workers who are more likely to dwell in the city.
An alternate transportation network of private buses—fully equipped with wifi—thus threads daily through San Francisco, picking up workers at unmarked bus stops (though many coexist in digital space), carrying them southward via the commuter lanes of the 101 and 280 freeways, and eventually delivers them to their campuses.
What does this flow tell us about Silicon Valley, and the City it feeds?
A core component of Stamen Design’s practice is focused on harnessing data to visualize flows — flows of taxicabs carrying passengers throughout the city of San Francisco in Cabspotting (2006), flows of crime reports in Oakland in Crimespotting (2007), and in the case of The City from the Valley (2012), the flows of tech workers to, from, and within a region known for flux and dynamism.
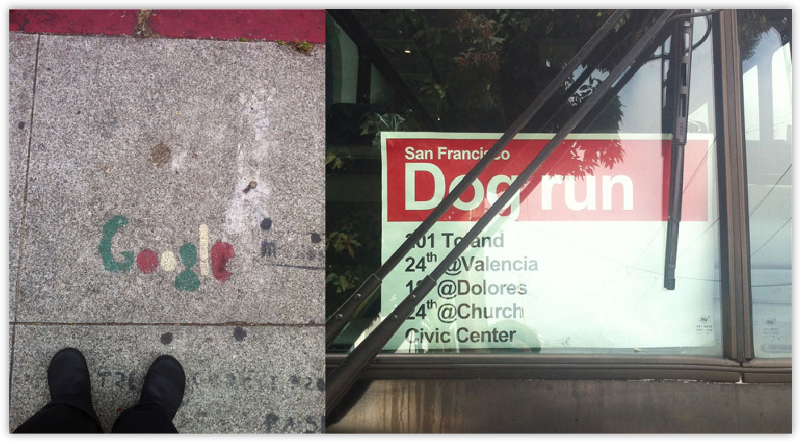
Several Stamen staff live on Google shuttle routes, so we see those shuttles every day. They’re ubiquitous in San Francisco, but the scale and shape of the network is invisible.
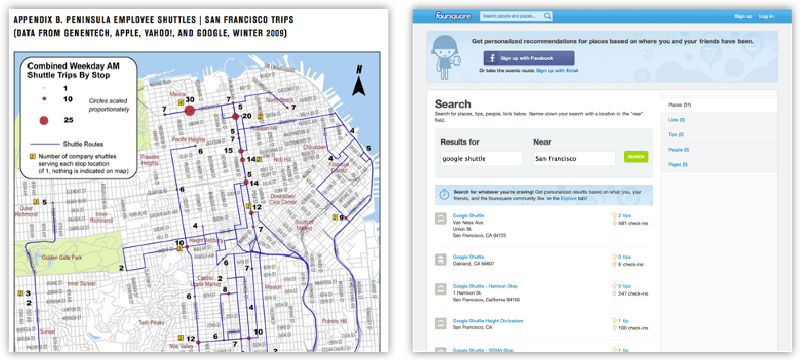
We decided to try some dedicated observation. We sat at 18th & Dolores one morning, and counted shuttles. We counted a new shuttle every five minutes or so; several different companies, high frequency. We also researched online sources like Foursquare to look for shuttle movements, and a 2011 San Francisco city report helped fill in gaps and establish basic routes.
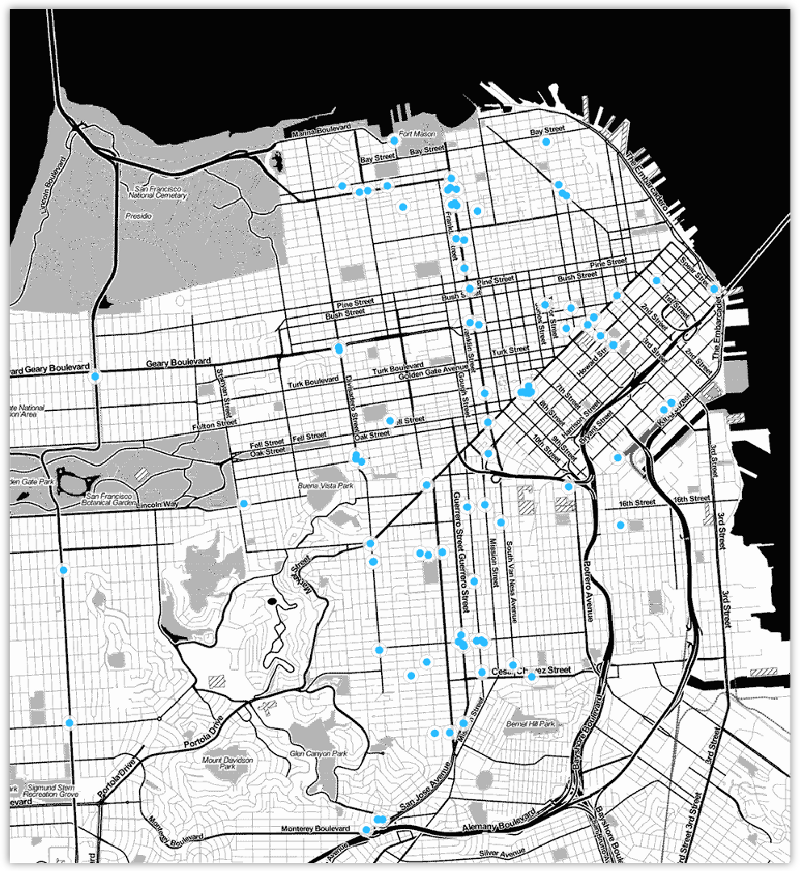
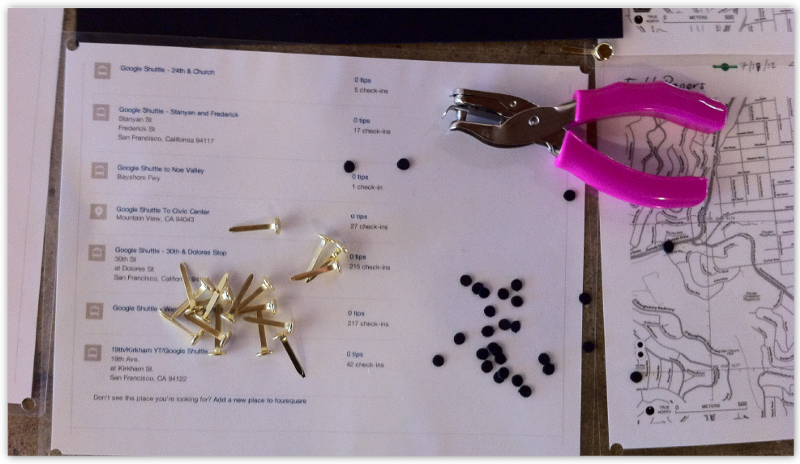
We were able to create a map of the various shuttle stops around the city using our Dotspotting site.
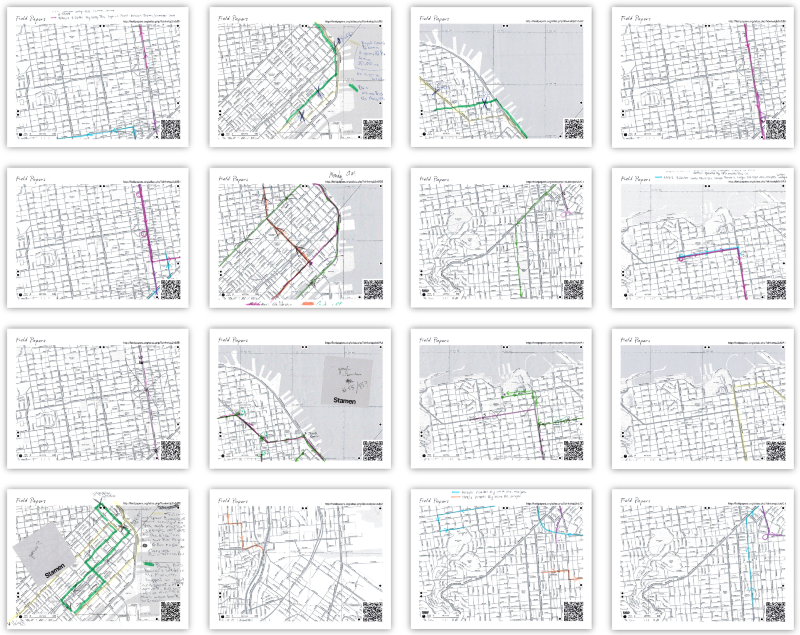
That’s when we realized how big this was, and that we’d need outside help. We enlisted people to go to stops, measure traffic and count people getting off and on and we hired bike messengers to see where the buses went. The cyclists used Field Papers to transcribe the various routes and what they found out, which we recompiled back into a database of trips, stops, companies and frequency. At a rough estimate, these shuttles transport about 35% of the amount of passengers Caltrain moves each day. Google alone runs about 150 trips daily, all over the city.
We wanted to simplify that, to start thinking about it as a system rather than a bunch of buses, so we began paring down the number of stops by grouping clusters where the stops were close to each other.
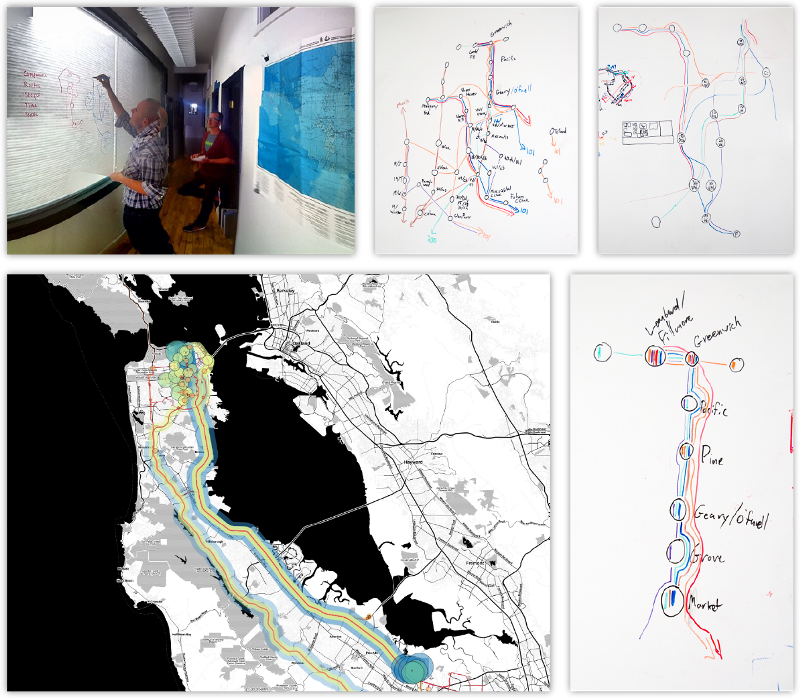
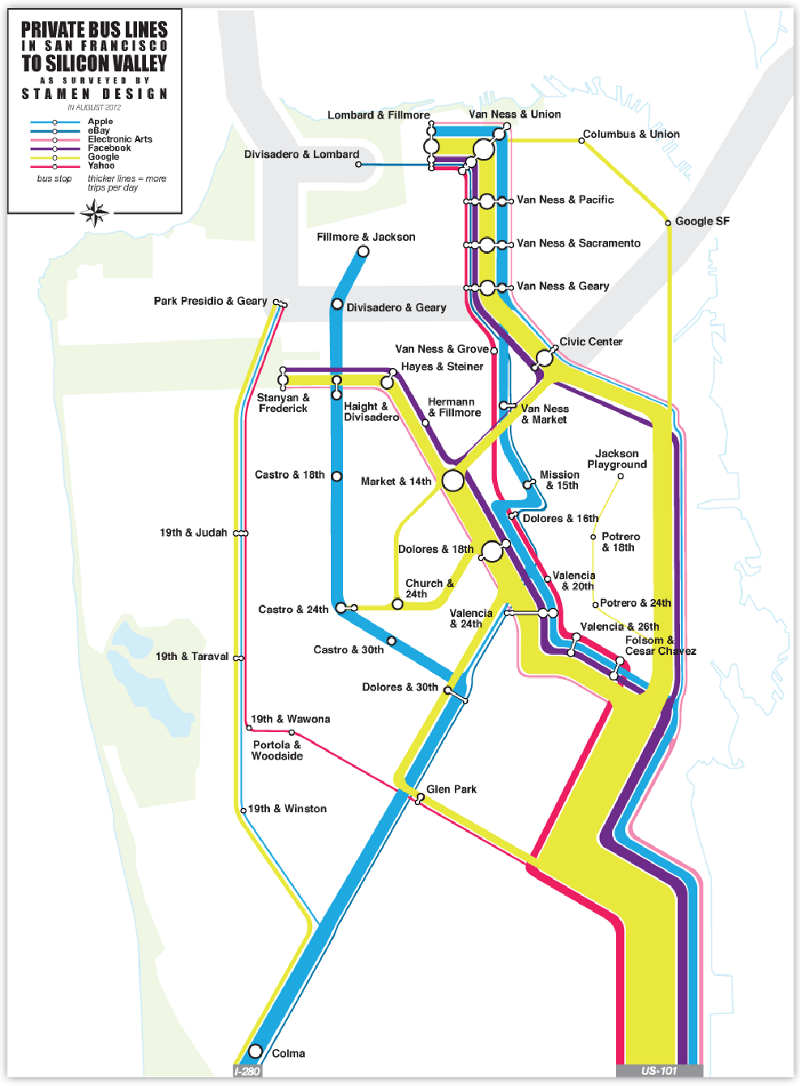
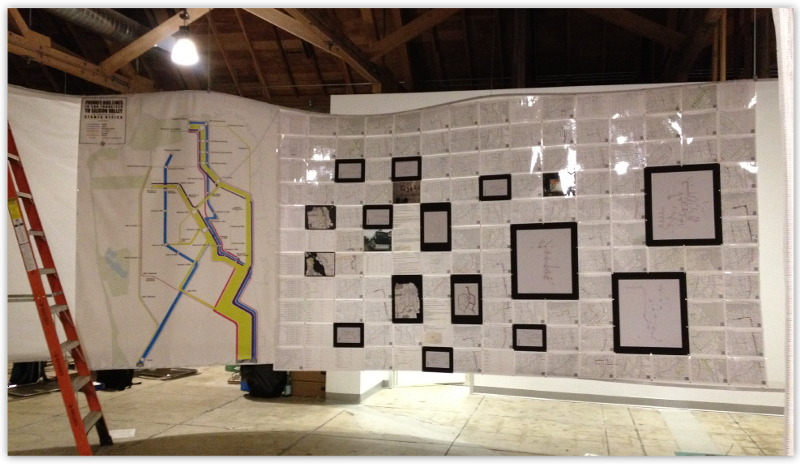
The subway map is the end result of that simplification; it’s not a literal representation, but it’s much more readable than the actual routes. We also wanted to show the relative volumes, so the map segments are scaled by how many trips pass through them; you get a sense for just how much traffic the highways get, and how the routes branch out from there to cover the city. We only mapped San Francisco shuttles, many of these companies operate additional routes in East Bay, the Peninsula, and around San Jose, including direct routes from Caltrain stations to corporate campuses.
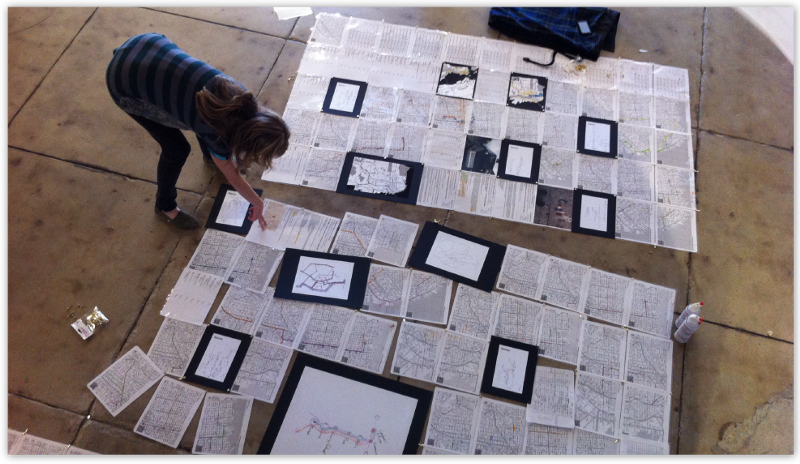
The final map is installed with our initial sketches and Field Papers.
The City from the Valley (2012) is a piece in ZERO1’s Biennial exhibition, Seeking Silicon Valley, on display at the ZERO1 Garage in San Jose, California from September 12 — December 8, 2012.
Press:
- Map Reveals Corporate Bus Routes Tech Workers TakeWall Street Journal, October 10, 2012
- Find a Private Shuttle Ride from SF to Silicon Valley on this MapKQED, September 27, 2012
- Where to catch the Google busPer Square Mile, September 26, 2012
- Silcon Valley’s high-tech bus commuter lines visualizedBoing Boing, September 25, 2012
- Shuttle buses taking over Silicon Valley, awesome visualization showsVentureBeat, September 24, 2012
- Mapping Silicon Valley’s Own Private “iWay”All Things D, September 22, 2012
- Tech, art intersect at Zero1 BiennialSF Gate, September 19, 2012
- Visualising the hidden networks of Silicon ValleyNew Scientist CultureLab, September 17, 2012
- With Seeking Silicon Valley, Zero1 Biennial Explores Tech-Fueled ArtWired, August 28, 2012