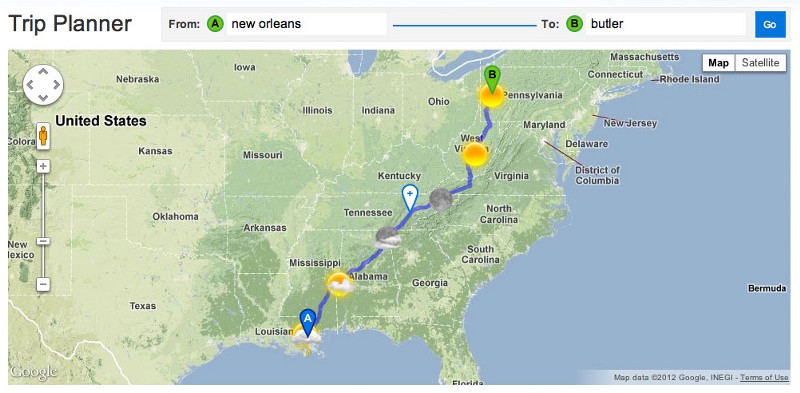
We’ve been working on a travel planner for the Weather Channel that tells you a bit more than just how long it’ll take to get from point A to point B. This one predicts what the weather’s going to be like along your drive,when you get there.
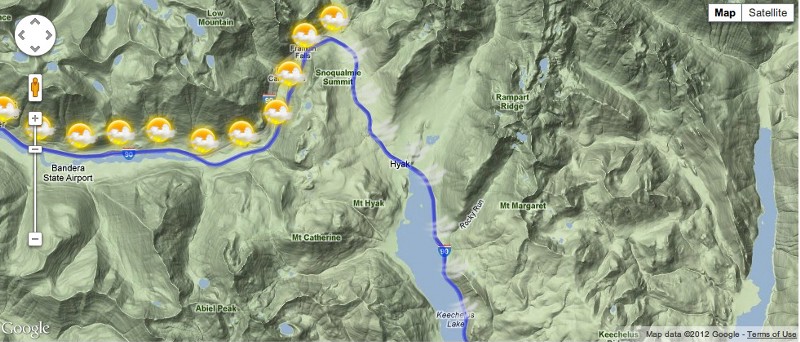
So let’s say you’re driving from New York to San Francisco, and you’re trying to decide whether to go straight across or loop up or down a bit; this will give you a sense for whether it’s going to be rainy or sunny when you plan to be in the middle of Nebraska. You can drag around the rainy bits if you like, and also along the way maybe you’d like to stop for a bite to eat, so we’re hitting the Yelp API to give you a sense of where to go and what to see.
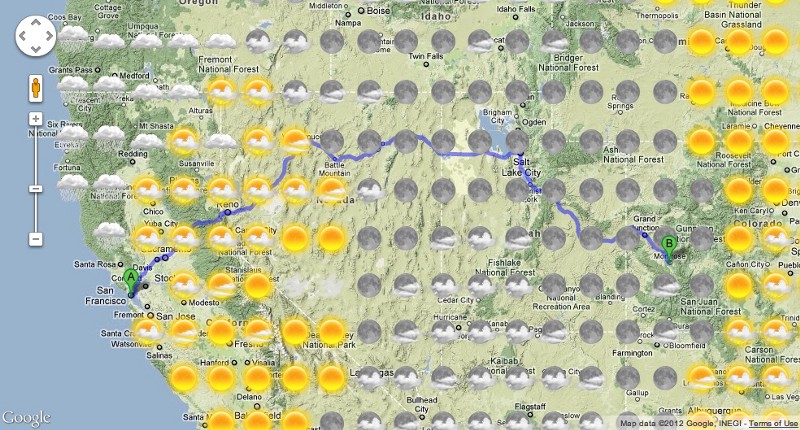
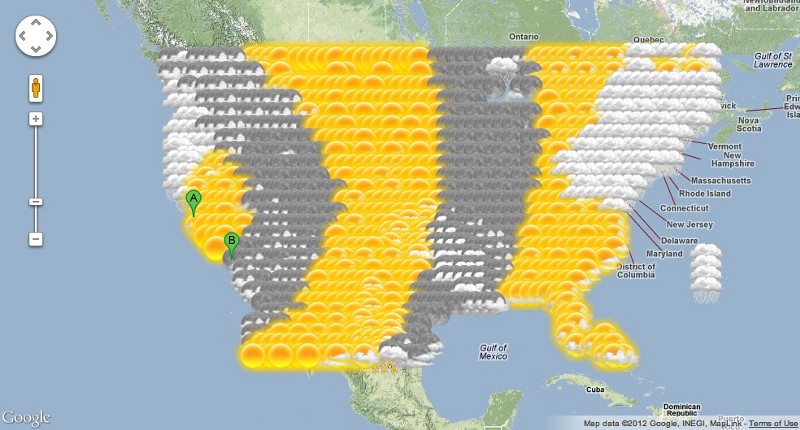
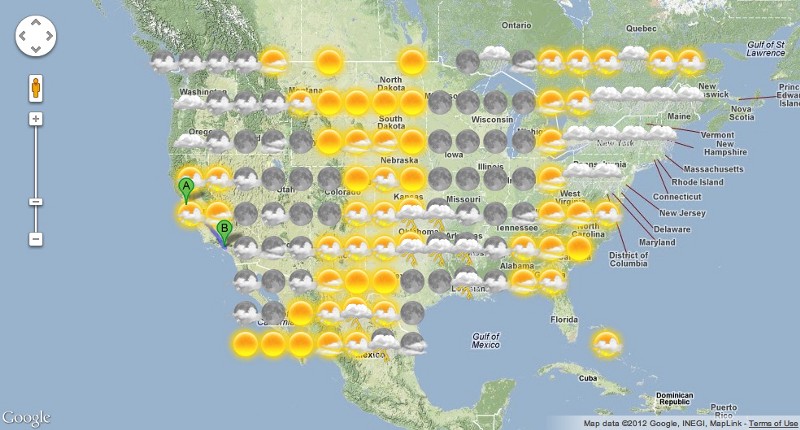
As is often the case, the research that goes into building one of these pieces can be as interesting as the final product. As an early stage proof of concept, we put together some images showing all the predictions for weather searches offset by time and location, with some (I think) lovely results:
They start to put me in mind of an early project we did here at Stamen, a set of travel time maps for MySociety that plotted the time it would take to get from one place in London to every other place in London:
I start thinking of weather maps that flow and ebb across the country, where different sliders open and ebb various kinds of other axes: time for sure, but maybe population density, maybe altitude, maybe temperature, maybe how many farms there are, maybe distance from a weather station or a McDonald’s — all the different kinds of things that affect people’s sense of place and space and time, organized by what’s above our heads.
Stay tuned!