
In late February 2014 MtGox, one of the oldest Bitcoin exchanges, filed for bankruptcy protection. On March 9th a group posted a leak of MtGox data, which included the trading history of users from April 2011 to November 2013. We’ve been collaborating with Kai Chang & Mary Becica on some visualizations of this data; they’re live as of today at http://bitcoin.stamen.com/.
These graphs explore the trade behaviors of the 500 highest volume MtGox users from the leaked data set. These are the Bitcoin barons, wealthy speculators, dueling algorithms, greater fools, and many more who took bitcoin to the moon.
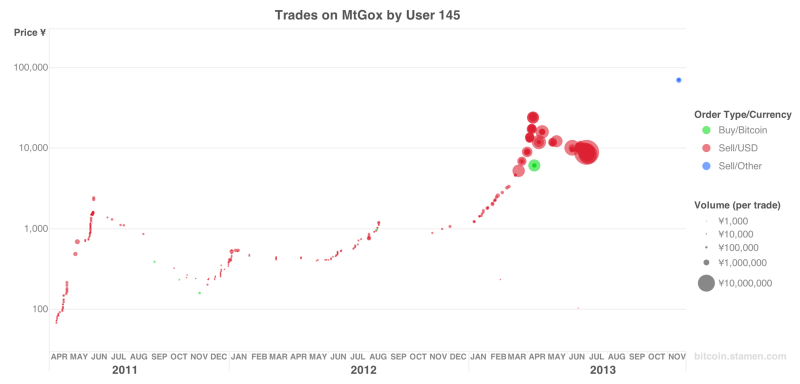
Bitcoin Barons
Barons are characterized by their early start in the market followed by big sells at higher prices. Initial trades with many sells suggest the user mined bitcoin before entering the Gox market.
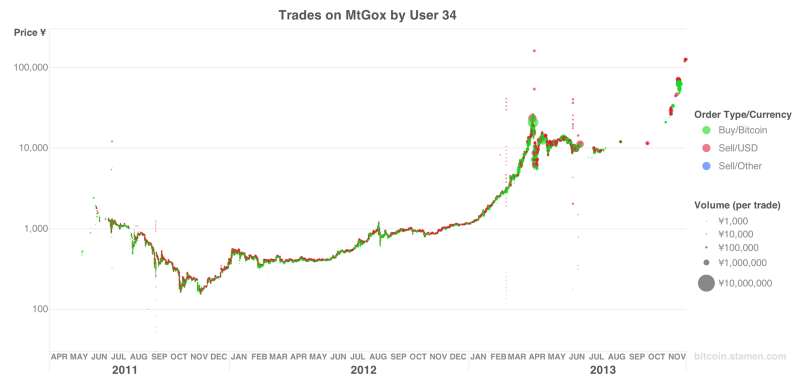
Dueling Bots
Automated traders can build up a large volume by making thousands of small trades. Vertical stripes of sells across a wide price range may also indicate algorithmic activity.
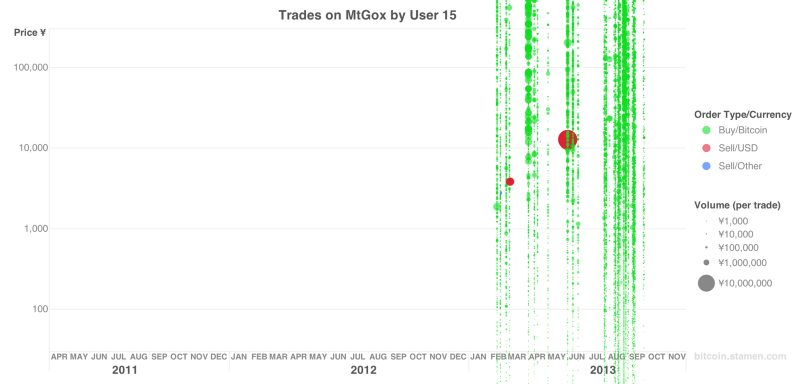
Glitch in the System
User 15 purchases large volumes of bitcoin at seemingly random prices. Why do so many traders sell at low prices to User 15? Why does User 15 buy at astronomically high prices? Are these faulty trades or an algorithm gone mad?
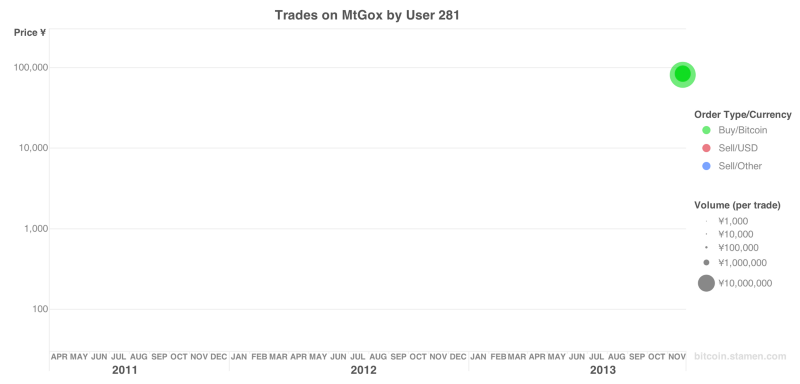
Greater Fools
The mark of the Greater Fool is a lonely green patch where the price is highest. Some of these may be investment groups encouraged by the Bitcoin Senate Hearings in November.
For more visuals (we’ve mapped the top 500), please see http://bitcoin.stamen.com/. You can take a look at some previous visualizations of markets Stamen has done here and here.