
We’ve got some new additions to Toner, the black and white style that Geraldine started and that Nathaniel and Mike have been gradually improving this year. There are some fairly significant changes to the cartography stack all the way through, which you can read about in detail at the project’s visual changelog on GitHub. And of course everything’s open source and available for download as per the terms of the Citytracking grant.
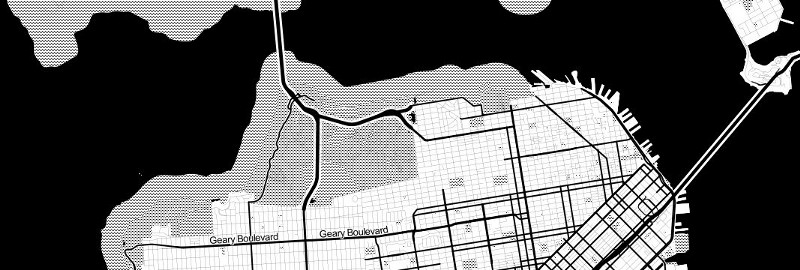
We promised to do this work in public, so here goes. One significant thing we’ve decided to do is to keep older versions of the project around, so that we (and, hopefully, you) can compare the different versions of the maps. So when Nathaniel talks in his post about “shaving San Francisco’s Mohawk” from how it looked in 2010:
to how it looks in 2012, with a better coastline:
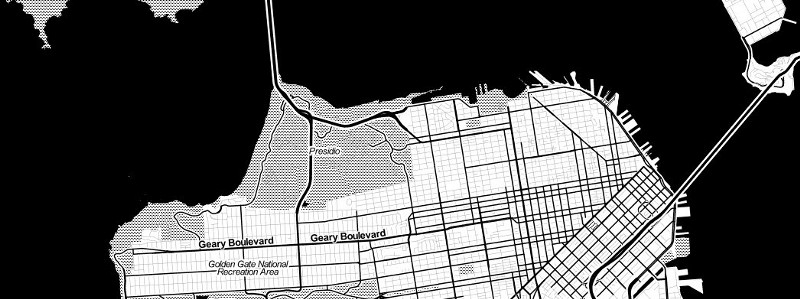
you can see it in situ. It’s pretty simple to change the urls:
2010: http://maps.stamen.com/toner-2010/#13/37.7783/-122.4492
2011: http://maps.stamen.com/toner-2011/#13/37.7783/-122.4492
2012: http://maps.stamen.com/toner-2012/#13/37.7783/-122.4492
The changes can be fairly visually dramatic, as in the addition of non-Roman scripts to places like Tokyo:
The thing about designing maps is that you’re never designing just one view. For one thing, it’s important to account for all the different zoom levels: it’s about showing more as you zoom in, but it’s also about showing different things at different scales. Choices need to be made at every level about the thicknesses of streets, which buildings to show, which city name to show, and so forth. Different places have different characteristics spatially; some are more dense than others, and you have to keep the whole system in mind. These two versions of the zoom into DC, from different years, gives a sense of the range of choices involved:
2010:
2012:
I’m not aware of any other mapping projects that let you look back in time as a design evolves this way.