
Climate change is one of those things that can be so invisible, and in some cases so subtle, that it can be hard to conceptualize. Over the years, our work with Climate Central has sought to make one symptom of this looming problem — sea level rise — much easier to see. The maps we’ve made together reveal what’s lost as water makes its way upon our shores, rather than the mass of land that’s left behind. Our most recent work with them, in partnership with New America Media, shows us very clearly what we’d lose in California: the homes of hundreds of thousands of people.
90,000 of those people live in San Mateo County alone, 50,000 of whom are ethnic and racial minorities. Climate Central estimates the cost of this damage to be in the realm of $22 billion. Cities all along California’s coast will face similar losses.
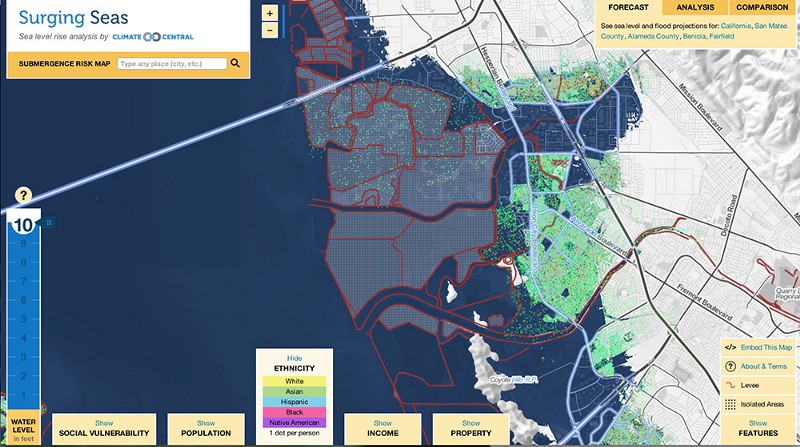
This version of the map, released today, lets us see a very poignant and personal part of the story, one more specific and far more real than a population density map could reveal. Inspiration for this method came by way of the by the Cooper Center’s Racial Dot Map.
It’s not just the numbers that are blowing our minds. It’s the difference that we’re seeing in each city and state, each of which has different a different datasets, and different levees for that matter.
We can see in Hayward that a large Black and Asian population will be affected:
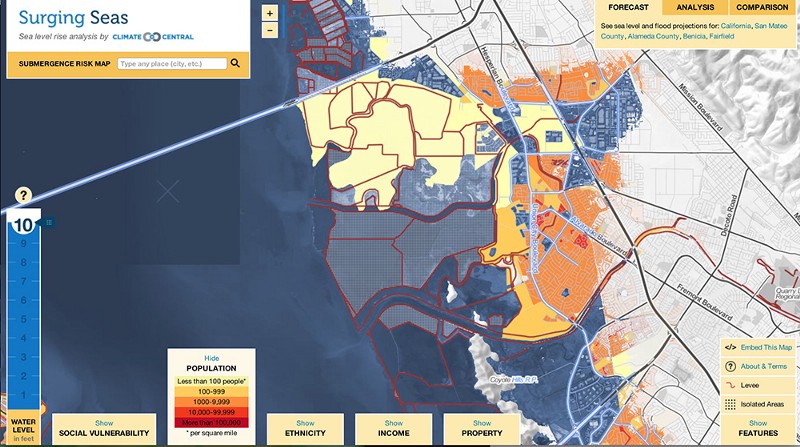
Here are some specific numbers:
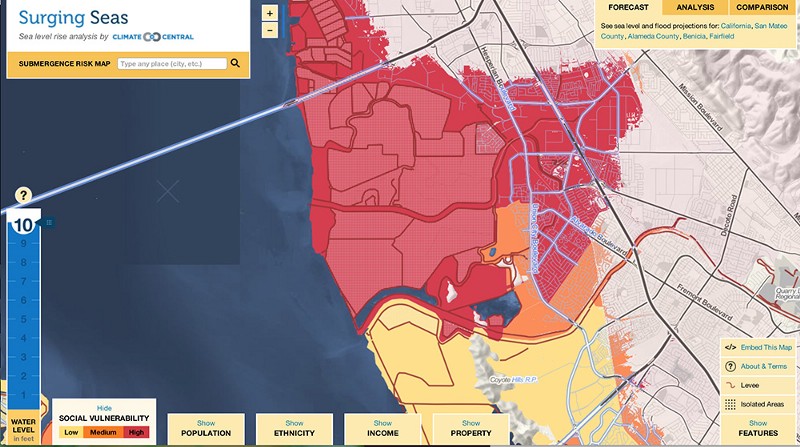
And here is the overall social vulnerability for the area:
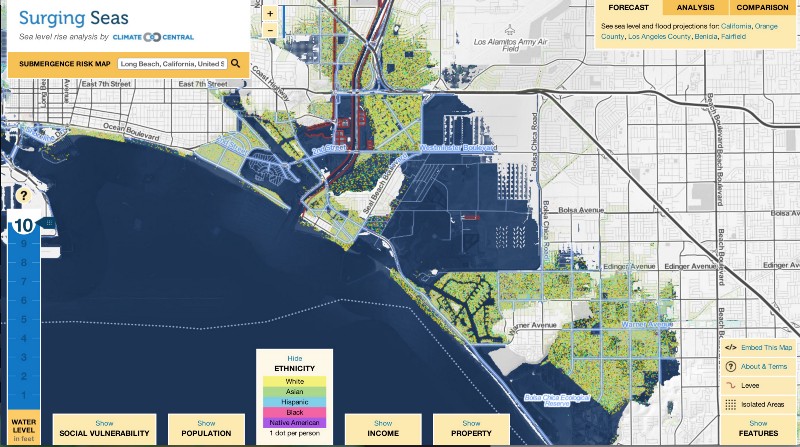
Long Beach tells a different story:
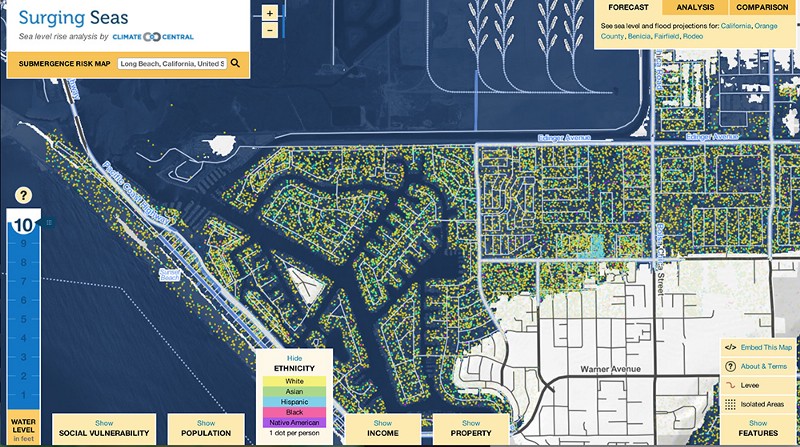
Here’s a closer view.
Reports and maps for coastal California cities can be found on Climate Central’s website, as well as sea level rise visualization and analysis for coastal continental US.
It’s all becoming ever more real. And now we can see it coming as we never could before.