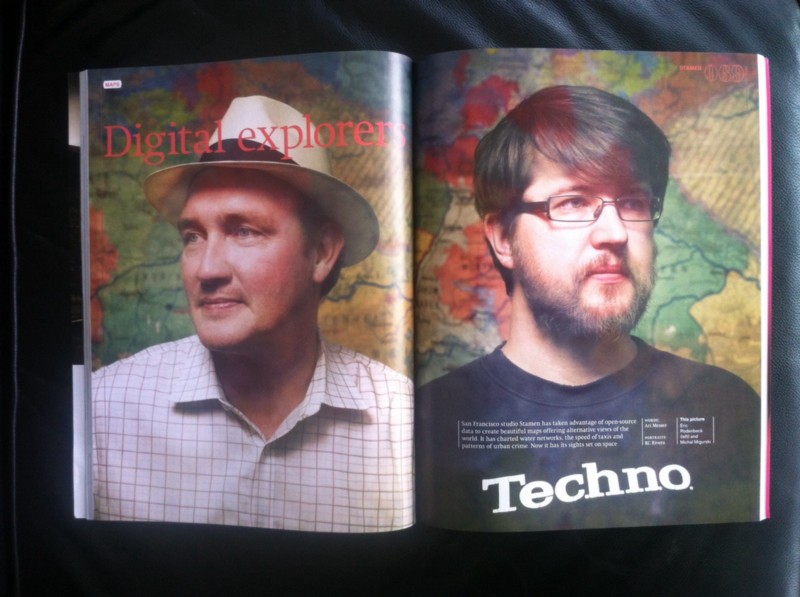
We’re the cover story (!) of this month’s Icon Magazine, featured alongside my longtime heroes at the Center for Land Use Interpretation as part of the maps issue. Ari Messer did a terrific job on the interview, and R.C. Rivera spent an afternoon photographing our plant- and map-filled studio with some lovely results. Unfortunately Shawn wasn’t here for the photographing (I think he got married or something, whatever) so it’s just Mike and I on the front spread, but overall I’m super happy with the resulting portrait of where the studio is now: 13 people, working in a garden in the middle of a vibrant city, a strong ethic, and maps and visualizations in active use by the public.
There’s a lot in the article, but this bit is one I like enough to want to post here. I think it was me, who said:
Stamen finds inspiration everywhere, but Rodenbeck hopes that the public will stop conflating infographics with data visualization. “The rise of the infographic as a genre is a little depressing. Back when desktop publishing started, people were worried that there would be no more room for designers, that computers would do all the work for you. But this clearly didn’t turn out to be the case.” While someone without design training [or skill — E] could make use of desktop publishing to create a holiday card or office leaflet or company newsletter, the band at the top for good designers actually grew. In a similar way, he says, “infographics have become the mother’s day cards — the company newsletters — of data visualization.”
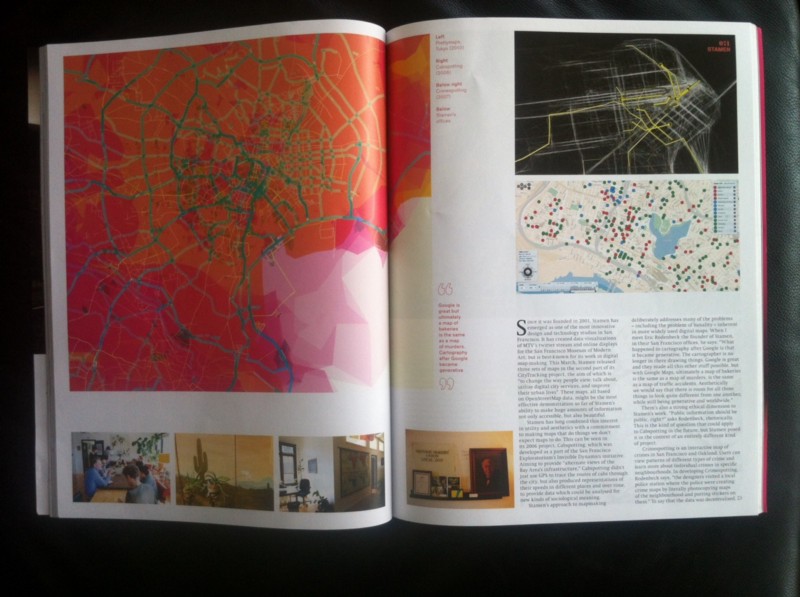
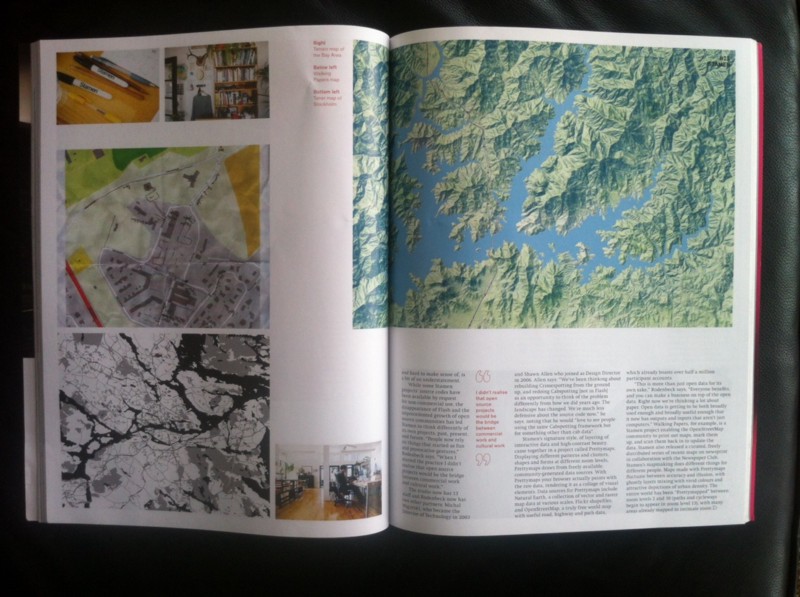
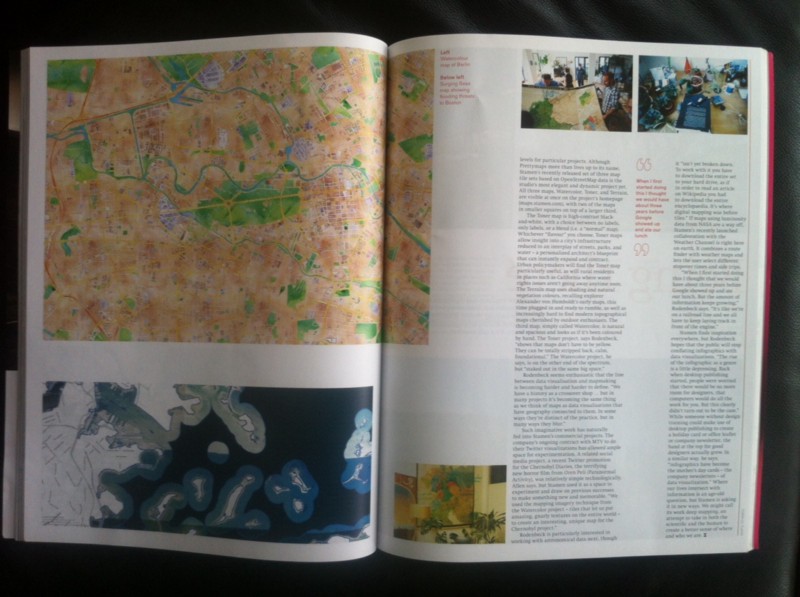
Luckily, my office was a total wreck when R.C. took some pictures of it, but it gives a pretty good sense of what it’s like around here these days: