
Remember being a kid and daydreaming about what it would be like if school wasn’t just rows of desks and boring classes? What if you could go to a school where, instead of memorizing facts you may never reference again, you learned how to garden, make art, build things (based on math equations!), and work on projects of your choice?
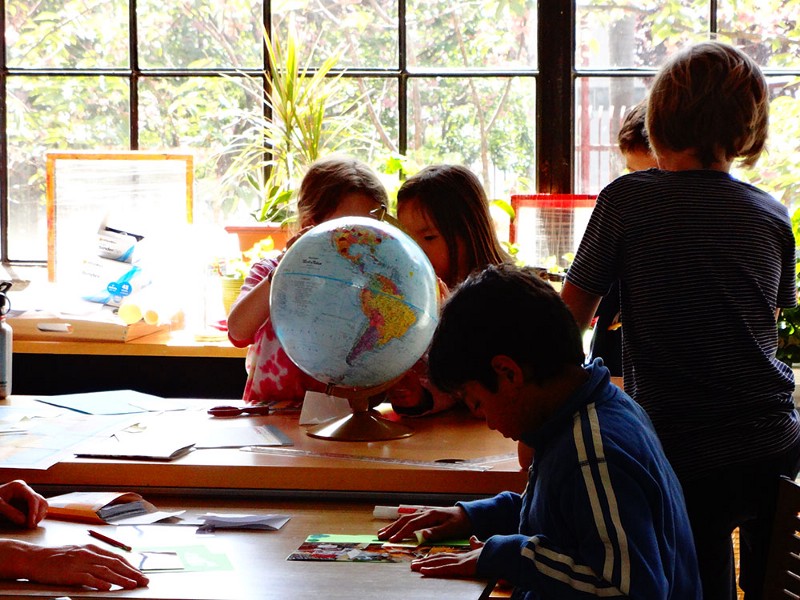
This daydream has come true just around the corner from Stamen at Brightworks, an exploratory school whose method is rooted in project-based learning. Right now the kids’ curriculum is focusing on maps, wrapping up a month-long study covering wayfinding, ecosystem maps, map projections, topology, and more. Stamen was invited to Brightworks for an afternoon visit, where we got to have a show-and-tell about the kinds of maps we make.
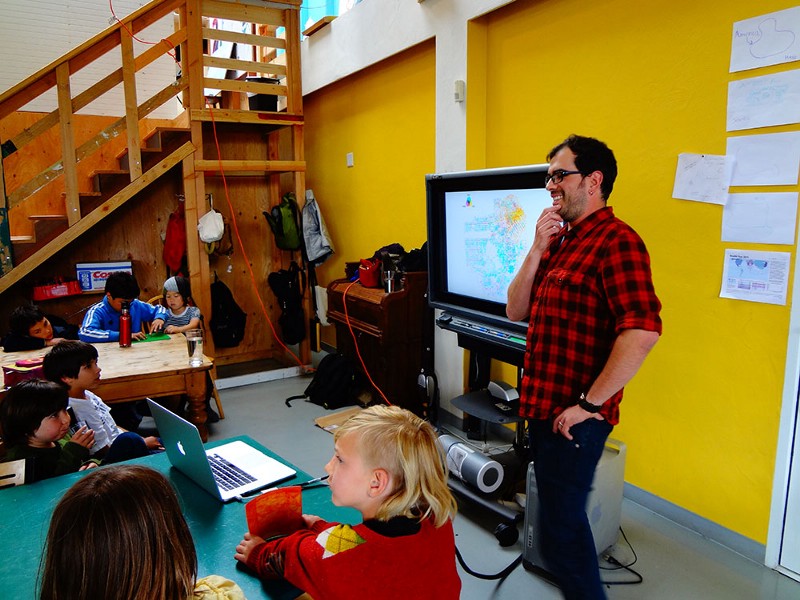
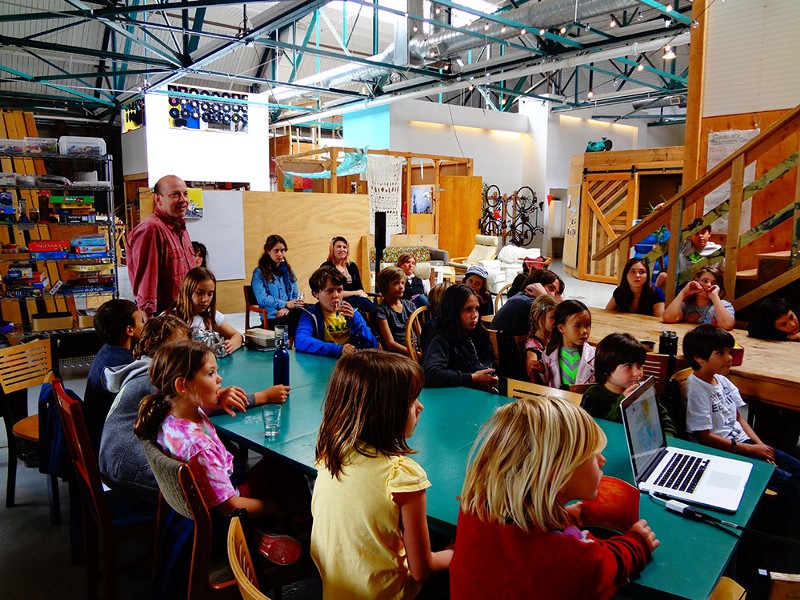
In our presentation, we covered a range of works, starting with maps and moving into data visualizations, answering questions from the (well-behaved, sweet and attentive) kids throughout the talk. Not surprisingly, the students made incredible observations and asked terrific questions. For maps.stamen.com, they wanted to know if we had made a watercolor painting of the whole world, which led to a discussion of mixing art and code, and creating CartoCSS (which they totally got). For Trees, Cabs, and Crime in San Francisco, they pointed out that there were no trees in Golden Gate Park. True! That’s because our tree data came from Friends of the Urban Forest, and most of their trees are planted along sidewalks. We’d ask them questions too, like “What is data?” and “What are maps?” garnering responses like “Data is code” and “Data is information” and “a map is a picture of information.” They put it together themselves that maps are pictures of data, and data can be anything, so you can make a map of anything too.
That connection made it easy for us to talk about data visualization works like A Day of Financial Transactions on NASDAQ and the Photo Sharing Explosions from Facebook Stories. They loved the explosive animations the best and made us replay the AbFab one a couple of times. Their favorite part in that one was the final explosion at 0:24, which they referred to as Pink Panther Pooping and then exploded in laughter. We have been giggling about it ever since!
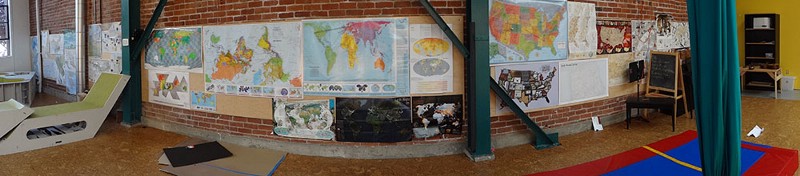
When we were done, the kids thanked us and then ran off to finish their day. We got to take a moment to explore their space, an open warehouse (no classrooms!) which includes a communal meeting area, a kitchen, an art-making space, and a tinkering lab.
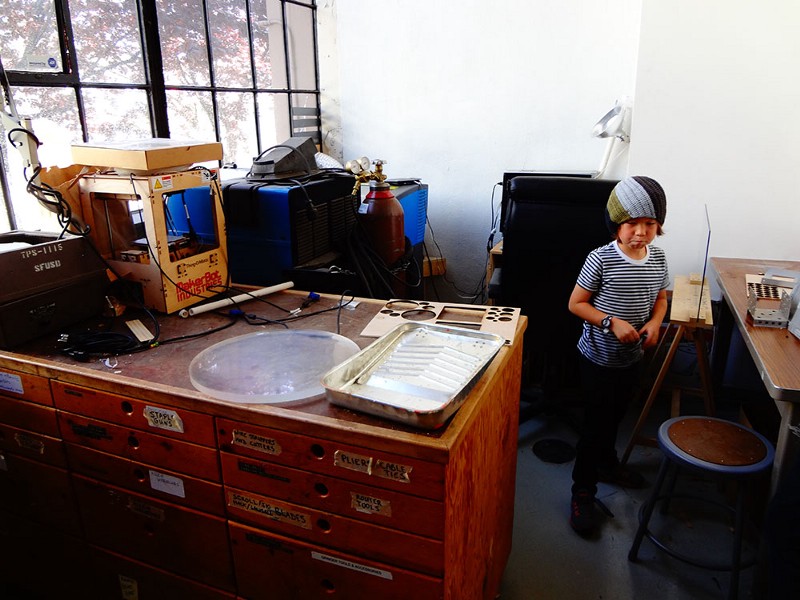
Yes tinkering lab! Above is a student (maybe 6 or 7 years old) showing us the 3D printer and laser cutter they have on hand. This is just after one of the Brightworks staff, Justine, shows us the shipping container outfitted with a table saw, where kids learn how to make things.
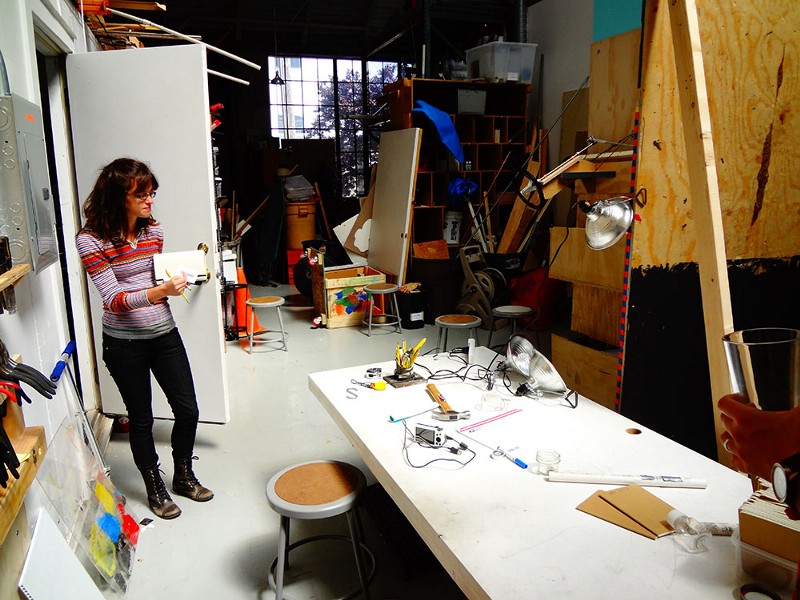
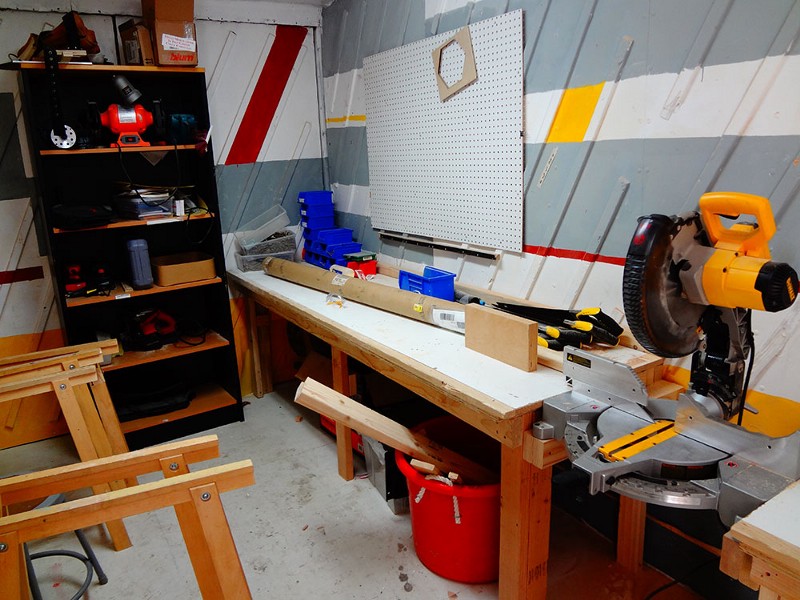
It’s just across the way from the artist in residence, who is on hand to make art and work with the kids, letting them ask questions about how she works.
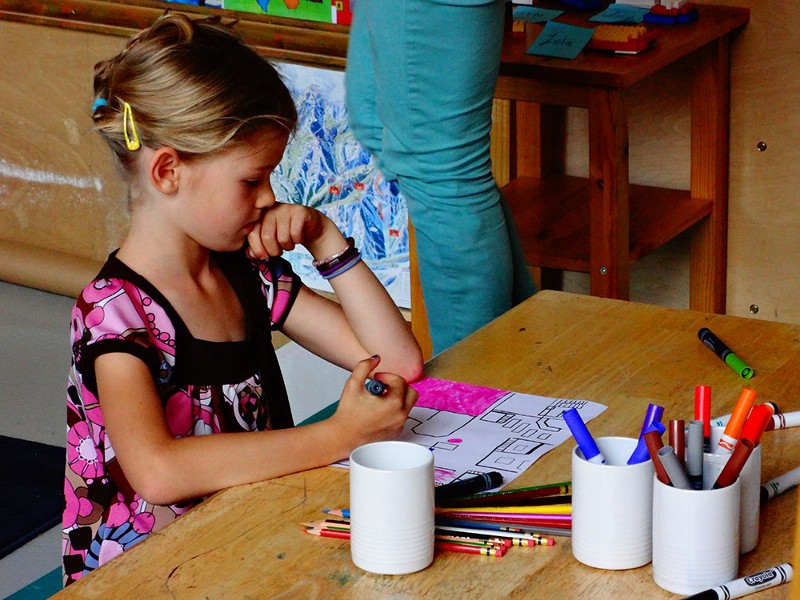
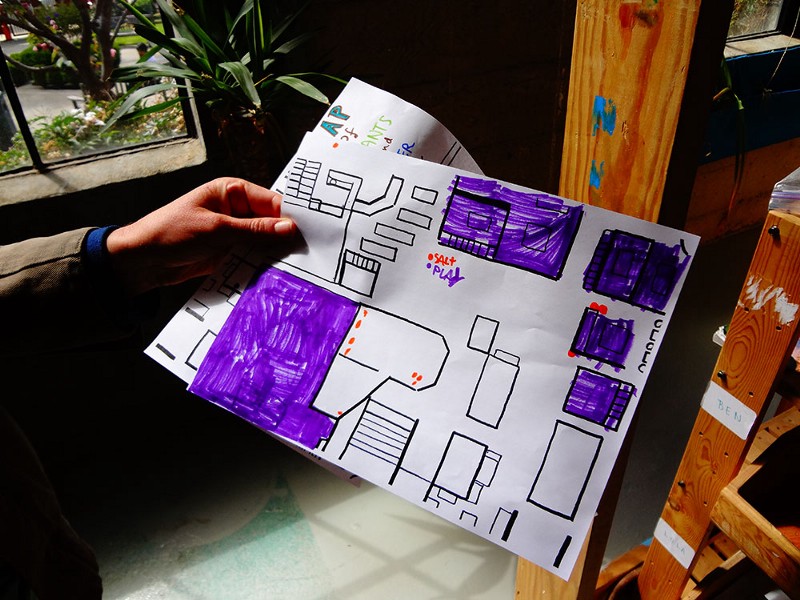
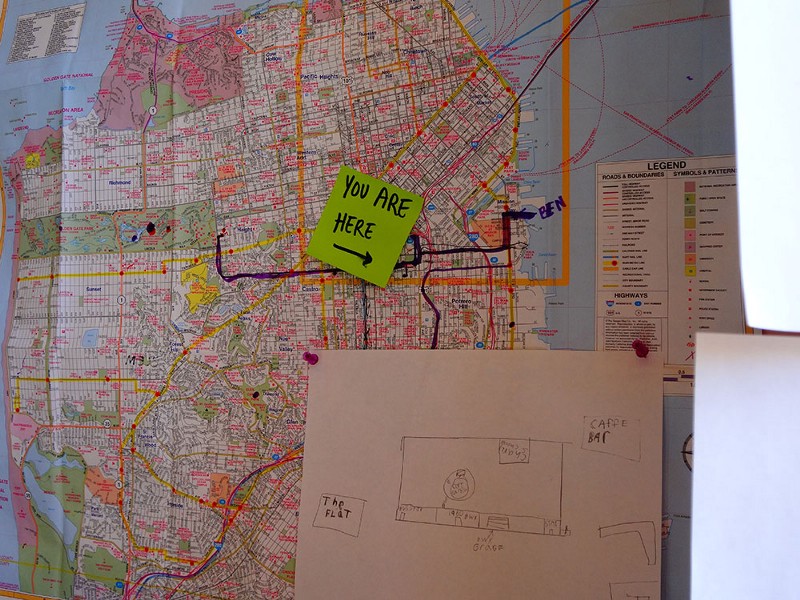
But we digress. From the maps. The kids have been making some:
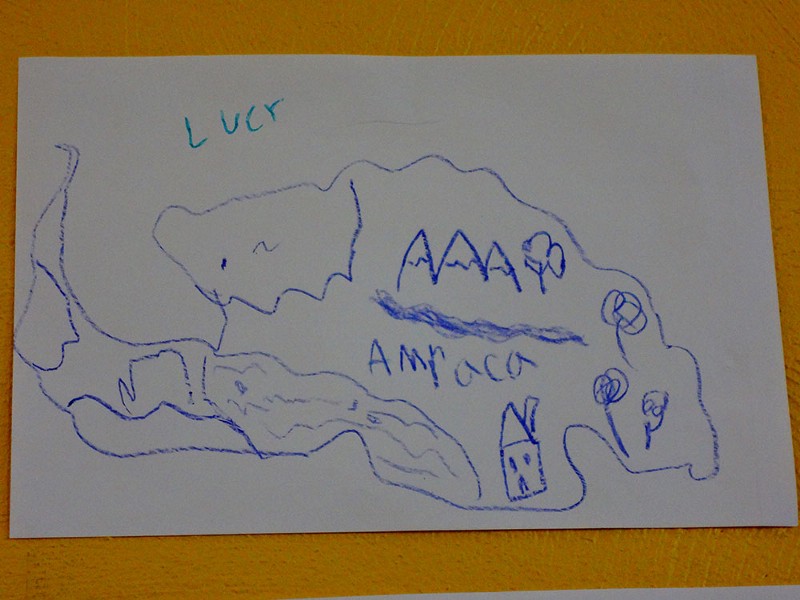
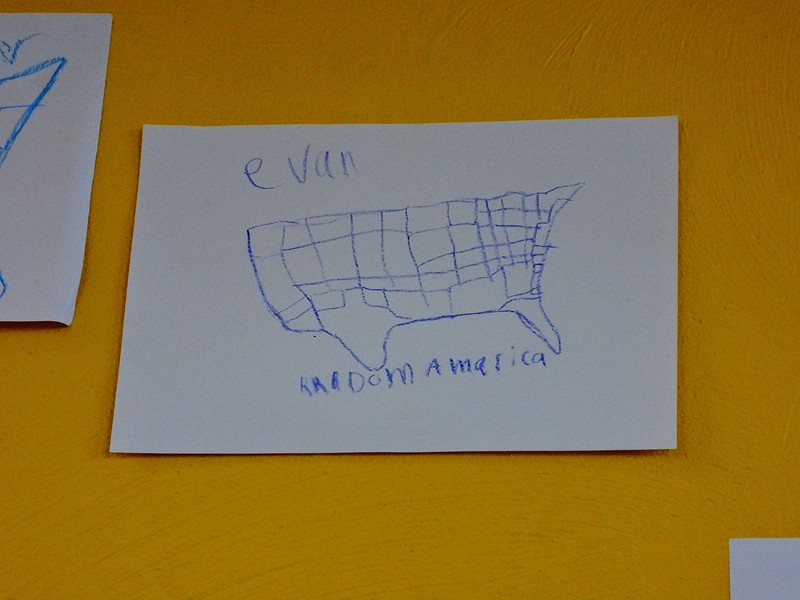
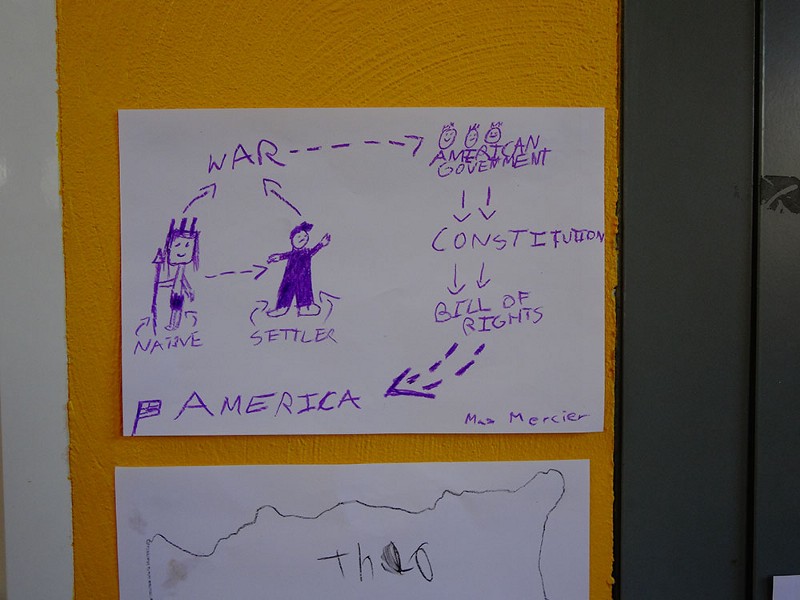
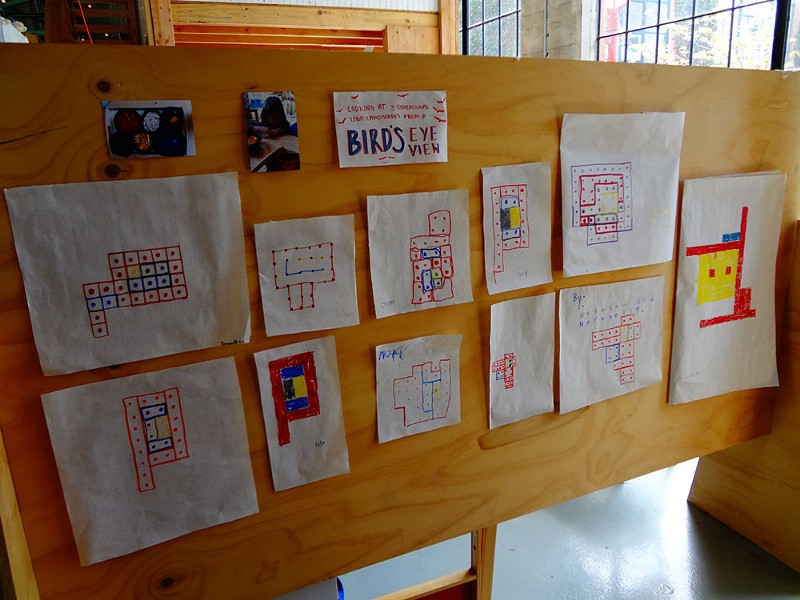
As we were leaving, they were making even more!
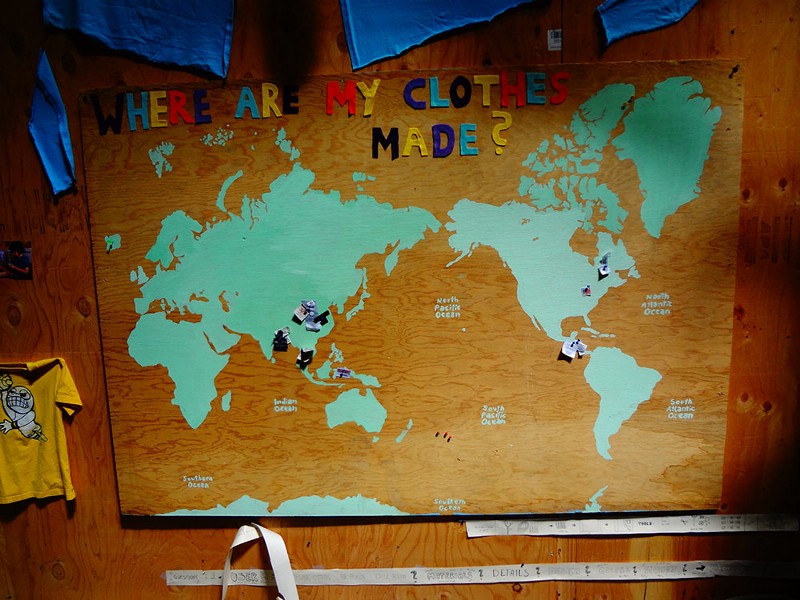
The whole school is covered in them! It’s like a mini-Stamen HQ, full of kids.
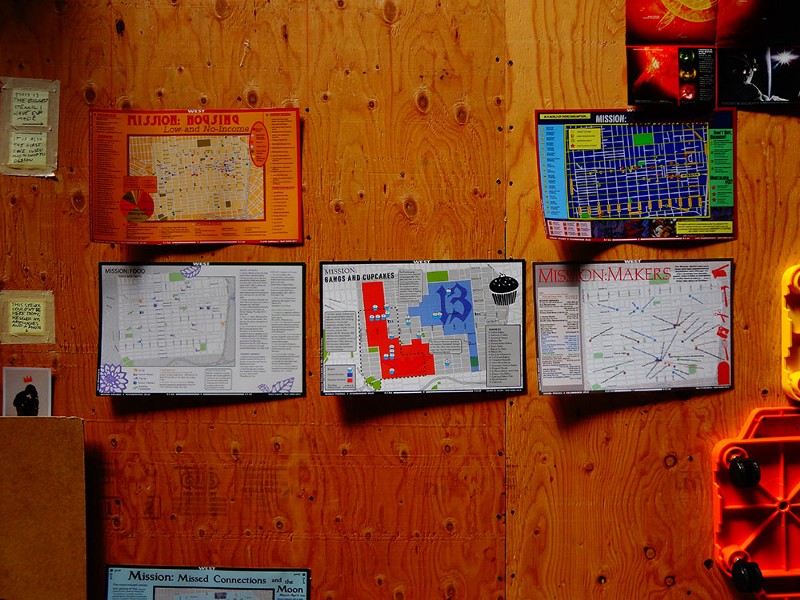
All these maps serve as inspiration for their round phase of work, where the kids take a whole month to work on a map-related project of their very own.
6–14 years old. Making maps. We can’t wait for our Age Reverser to be finished so we can all go to school there! In the meantime, we’re excited to visit Brightworks in June to see final presentations.