Aug 9, 2007
Data visualization, SOM, and the Transbay Tower in San Francisco
Craig Hartmann and Brian Lee, design partners in Skidmore, Owings and Merril's San Francisco office, unveiled their proposal for the new Transbay Transit Center and Tower in downtown San Francisco to a standing-room-only audience at San Francisco City Hall on Monday night. SOM asked Stamen to provide a series of potential live visualizations for the tower's main streetside entrance, to be curated by the San Francisco Museum of Modern Art. Our Cabspotting project, which tracks the positions of Yellow Cab taxis in San Francisco in real time, was used to illustrate the potential of this exciting new urban site during the public presentation.
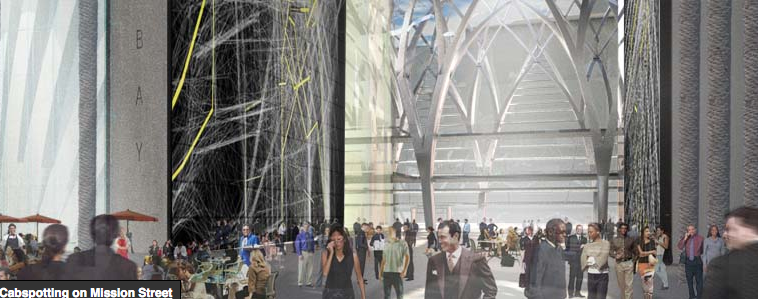
Stamen created a series of additional explorations of the Transit Tower entryway, extending the possibilities of live data visualizations in two areas: live graphic train scheduling, and densities in the urban fabric formed by the intersection of various transit routes.
Live train scheduling
E.J. Marey famously demostrated that a train schedule can be much more than a simple list of numbers and times—it can be deeply informative, rich in meaning and pattern, and a joy to use. The entranceway to the Transbay tower affords an opportunity to bring these ideas to the public in a lush new way, by using the walls of the building itself as an enormous indicator of upcoming transit activity as it passes through the terminal.
Trains, buses and other transit types are tracked in this system, and their positions and times to departure are indicated by their distance from the outside edge of the building. A passenger approaching the station from the street can find out just how much time they have until their train or bus departs, without having to do the mental math of checking the current time versus a posted schedule which may or may not be accurate. Over time, passengers could develop a mental model of the transit system at various times throughout the day, and understand quickly whether they need to run to catch their ride or have time for a drink at one of the Transit Center's many cafes and restaurants.
Public transit intersection maps
A transit system is more than a simple list of schedules—it's a deeply textured fabric of potential travel vectors, where the smallest of delays can create ripples throughout the system which can have a lasting impact on passengers' lives. BART schedules affect MUNI schedules and eventually all of these will need to be integrated into the 300mph bullet train linking San Francisco and Los Angeles. By being brought into contact with the current state of the entire transit system as it passes through the terminal, passengers could better understand the current range of transportation possibilities available to them, and make better decisions on where to go and when. A live display of the various networks that make up the Bay Area transportation network would bring the entire region into focus, and locate the Transit Center in the conceptual center of all of this activity.
Transportation networks in the entrance
Intersections of transit lines
Thanks to Gabriel Dunne and Ryan Alexander for their hard work on this project.
GET THIS TOWER BUILT!!!!