
Did you know that the Cabspotting project we designed with Scott Snibbe for the Exploratorium, is still going strong, providing a live view into the minute-by-minute realtime positions and status of the Yellow Cab taxi service in San Francisco? And that the project has an API that you can use to access this data in close to real time, provided you agree to keep us in the loop & not use it for commercial purposes and not to put too much strain on the server?
Eric Fischer and Alex Bayen (whose link is down at the moment) do:
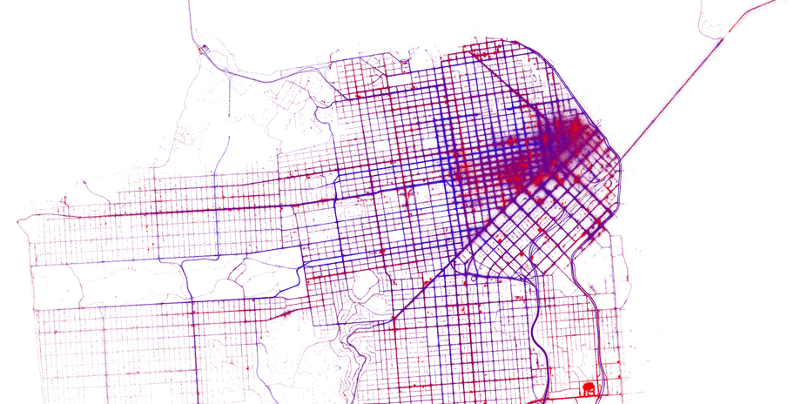
Eric Fischer, whose Locals and Tourists photoset on flickr tore up the charts a few weeks ago, has been taking similar techniques (red is for photos taken by tourists, blue is for locals) and applied them to taxi pickups and dropoffs in SF. The Cabspotting set on flickr has more examples, including origins vs destinations and more. In the image above you can see a clear concentration of red (empty cabs) in the lower right where the depot is, and a hotly contested downtown where an archipelago of red empties nestles in a sea of blue fulls.
And Alex Bayen sent us a white paper called “Estimating arterial traffic conditions using sparse probe data,” (link is down at the moment but you can get to it here in the meantime) which was presented at the 13th International IEEE Conference on Intelligent Transportation Systems, is about the extraction of overall traffic flows in cities from smallish amounts of data, and has images like this:
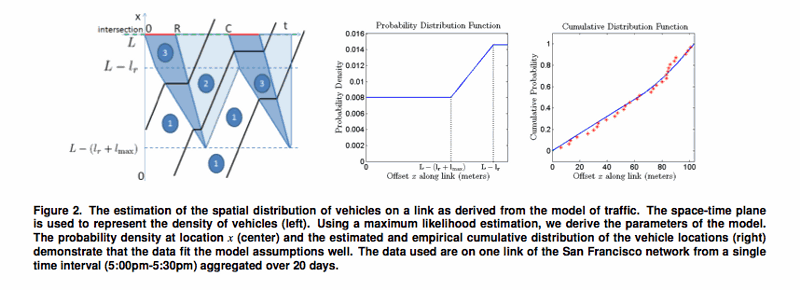
Which I understand about half of, but all of which I like.
The Cabspotting site has contact info if you’d like to get in touch about using this data for your own projects.