
What happens when you map the social media footprint of the great outdoors?
Last month, Stamen launched parks.stamen.com, a project we created in partnership with the Electric Roadrunner Lab, with the goal of revealing the diversity of social media activity that happens inside parks and other open spaces in California. If you haven’t already looked at the site, please go visit it now! Find your favorite park, or the parks that are nearest to you, or just stroll between random parks using the wander button. For more background about the goals of the project, read Eric’s blog post: A Conversation About California Parks.
In this post I’d like to describe some of the algorithms we use to collect the social media data that feeds the park pages. Currently we collect data from four social media platforms: Twitter, Foursquare, Flickr, and Instagram. We chose these because they all have public APIs (Application Programming Interfaces) that are easy to work with, and we expect they will provide a view into the different facets of each park, and the diverse communities who enjoy these parks. Each social media service creates its own unique geographies, and its own way of representing these parks. For example, the kinds of photos you upload to Instagram might be different from the photos you upload to Flickr. The way you describe experiences using Twitter might be different from the moments you document by checking into Foursquare. In the future we may add more feeds, but for now there’s a lot we can learn from these four.
Through the course of collecting data from these social network services, I also found that each service’s public API imposes certain constraints on our queries, producing their own intricate patterns. Thus, the quirks of how each API was written results in distinct and fascinating geometries. Also, since we are only interested in parks for this project, the process of culling non-park-related content further produces unusual and interesting patterns. Rural areas have large parks that cover huge areas, while cities have lots of (relatively) tiny parks, which creates its own challenges for how we query the APIs.
Broadly, we followed a similar approach for all the social media services. First, we grab the geocoded data from the APIs. This ignores any media that don’t have a latitude and longitude associated with them. In Foursquare, almost all checkins have a latitude and longitude, and for Flickr and Instagram most photos have a location associated with them. However, for Twitter, only around 1% of all tweets have geographic coordinates. But as we will see, even 1% still results in a whole lot of tweets!
After grabbing the social media data, we intersect it with the outlines of parks and open spaces in California, using polygons from theCalifornia Protected Areas Database maintained by GreenInfo Network. Everything that doesn’t intersect one of these parks, we throw away. The following maps represent the data as it looks before the filtering process.
But enough talking, let’s look at some maps!
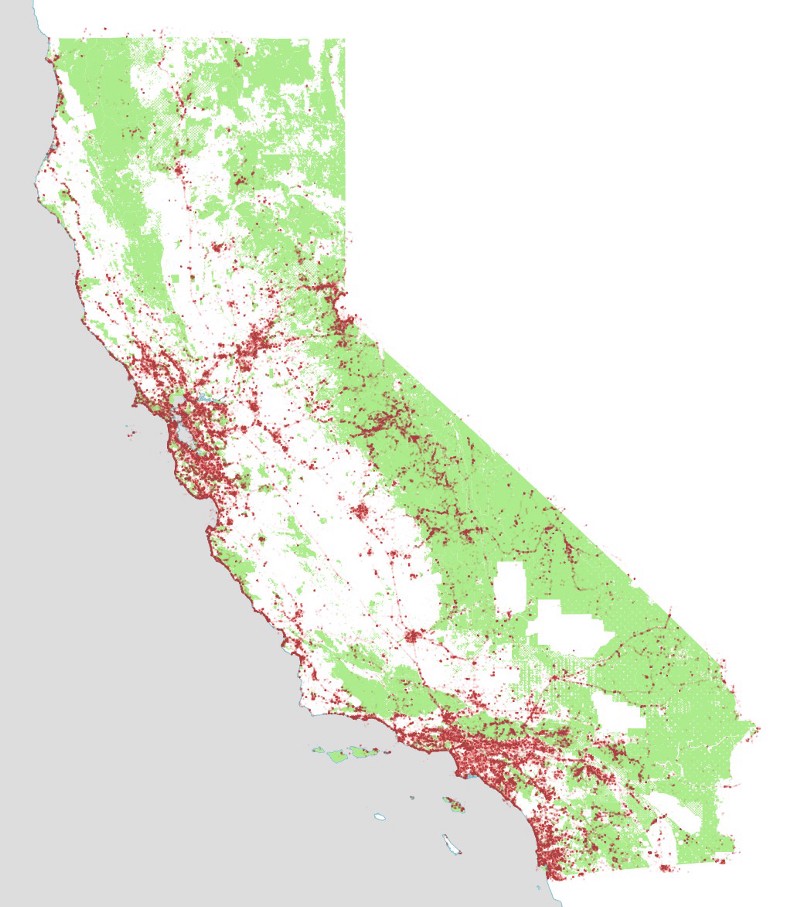
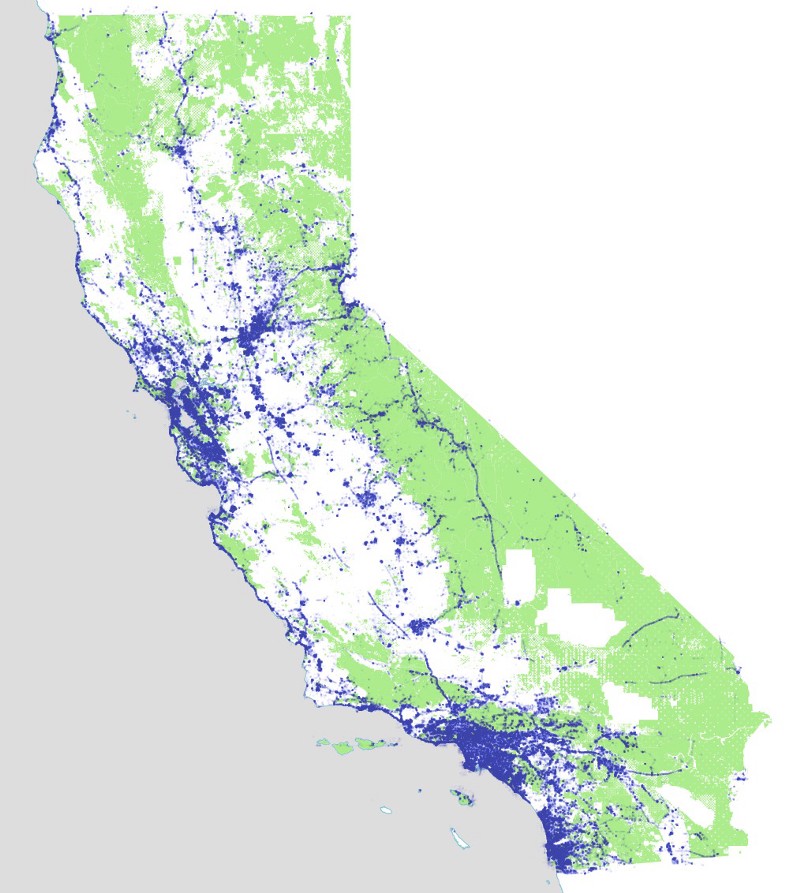
Collecting the Twitter data is straightforward compared to the other services. For Twitter we found it was easiest to request a bounding box that covers the entire state of California, and then later discard any tweets that don’t fall within the boundaries of any of the parks.
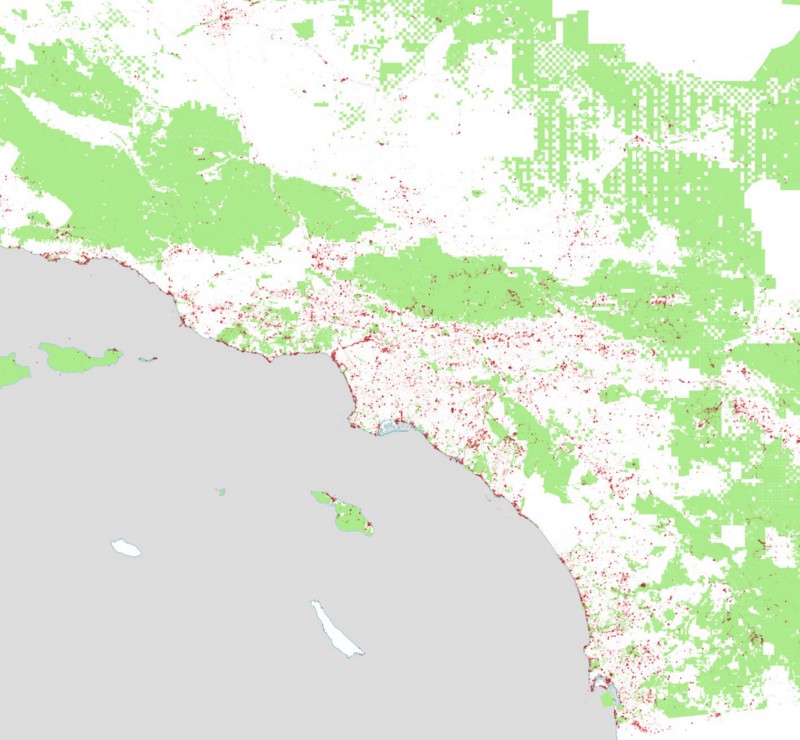
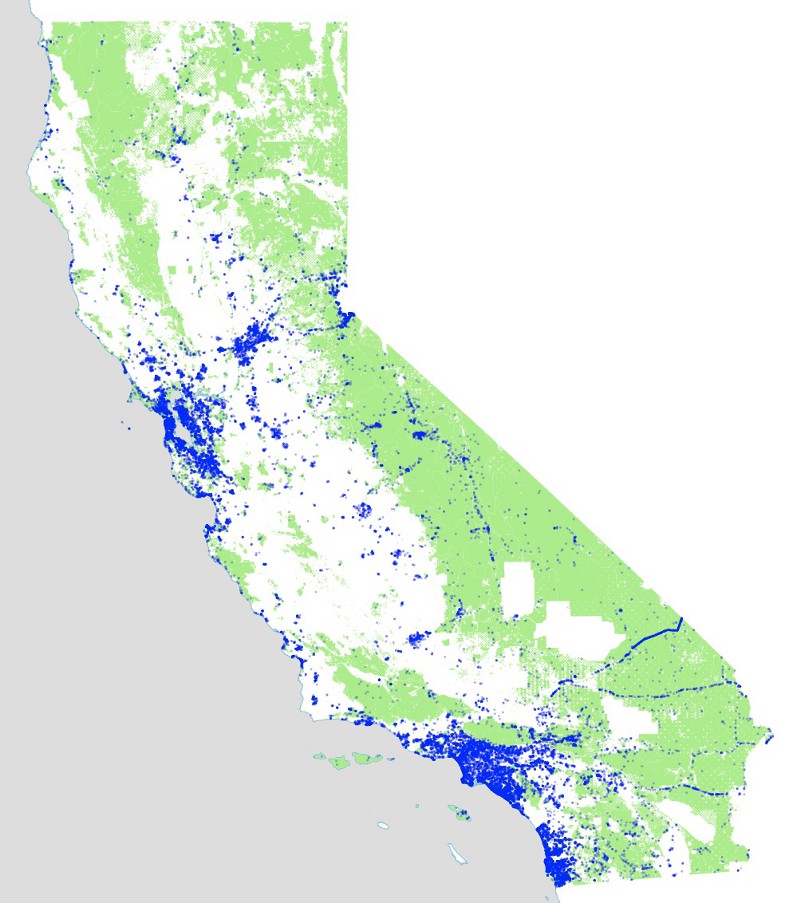
This map shows all the tweets we’ve collected since December 2013. As you can see, our California bounding box also grabbed Las Vegas as a side effect, and also seems to be getting a fair number of tweets from Arizona, even though those fall outside the bounding box itself.
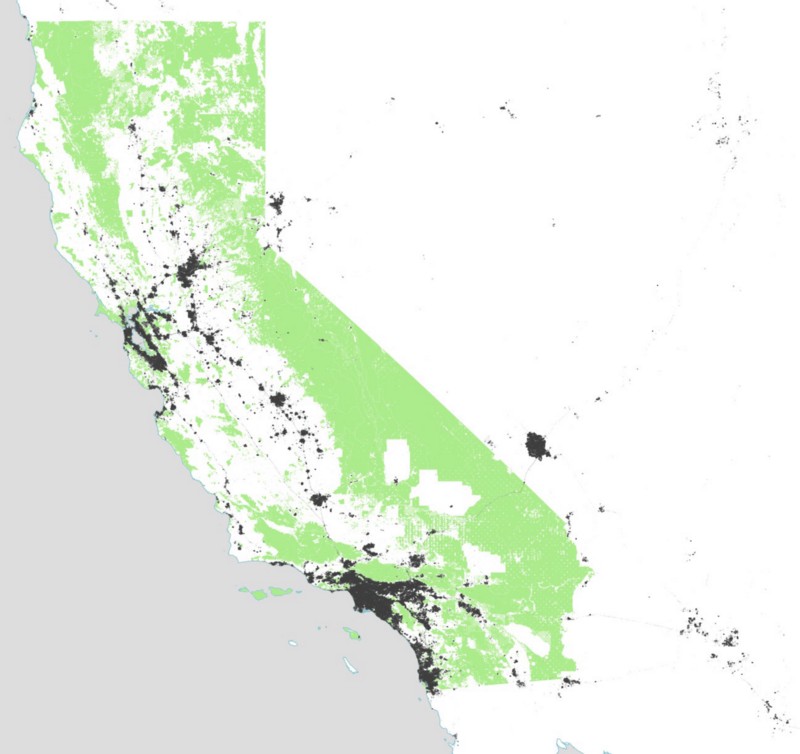
Note at this zoom level there are so many tweets in the urban areas that they blend into a solid black color. We have to zoom in to see more detail. I’m not doing any of the tricks needed to pull out the detail at this scale. If you’re interested in highly-detailed maps of tweets, you’ll be amazed by Eric Fischer’s work on the topic.
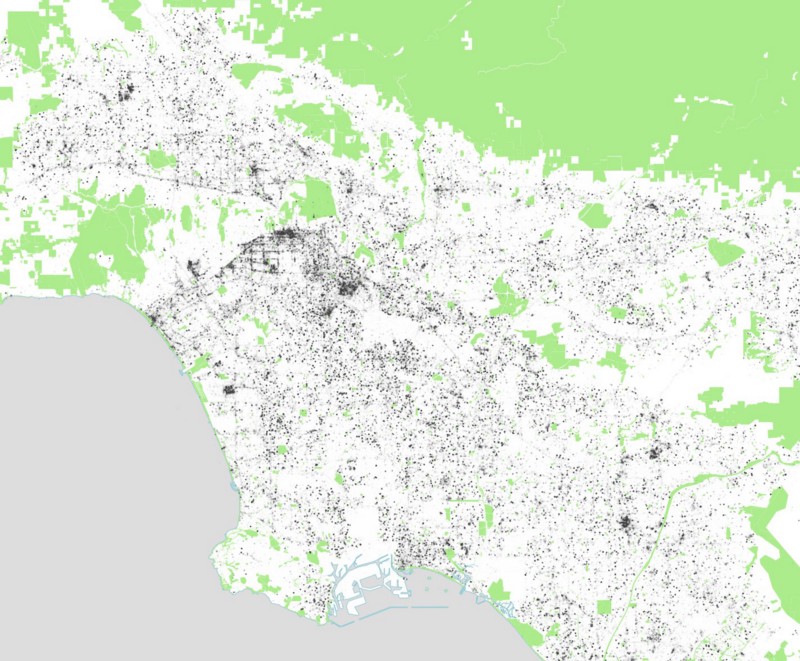
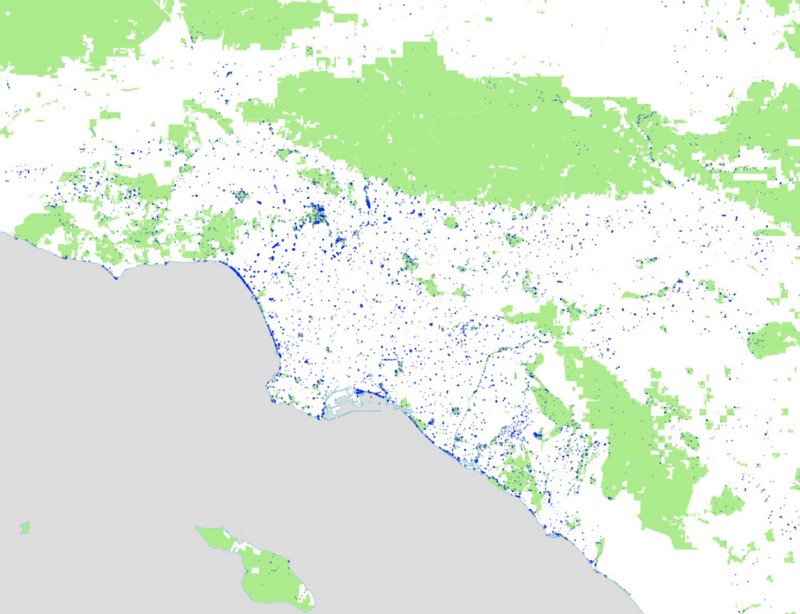
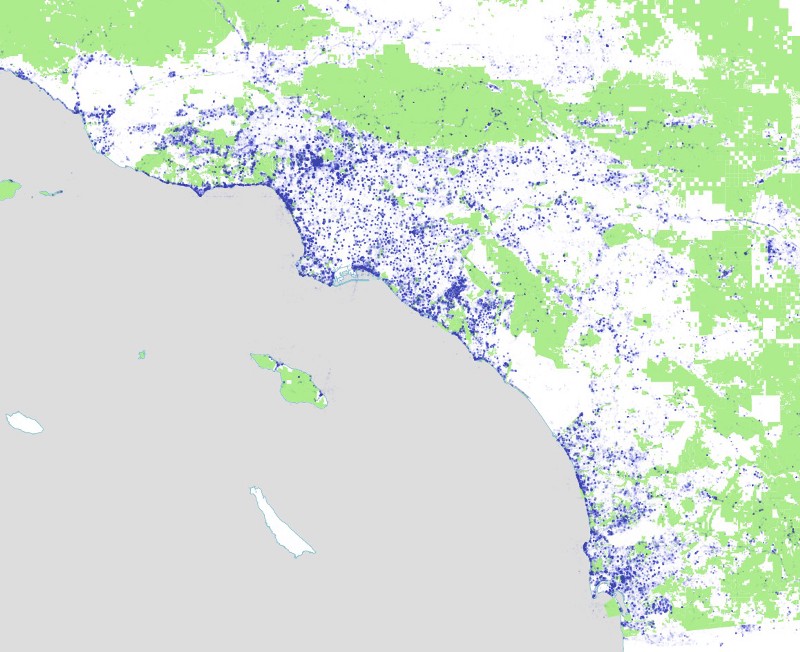
Here are tweets in Los Angeles:
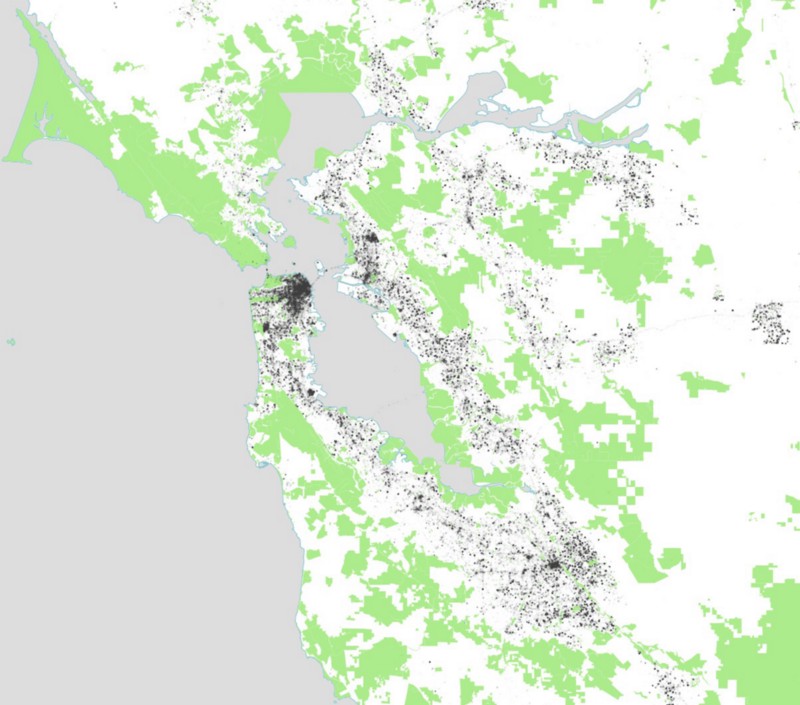
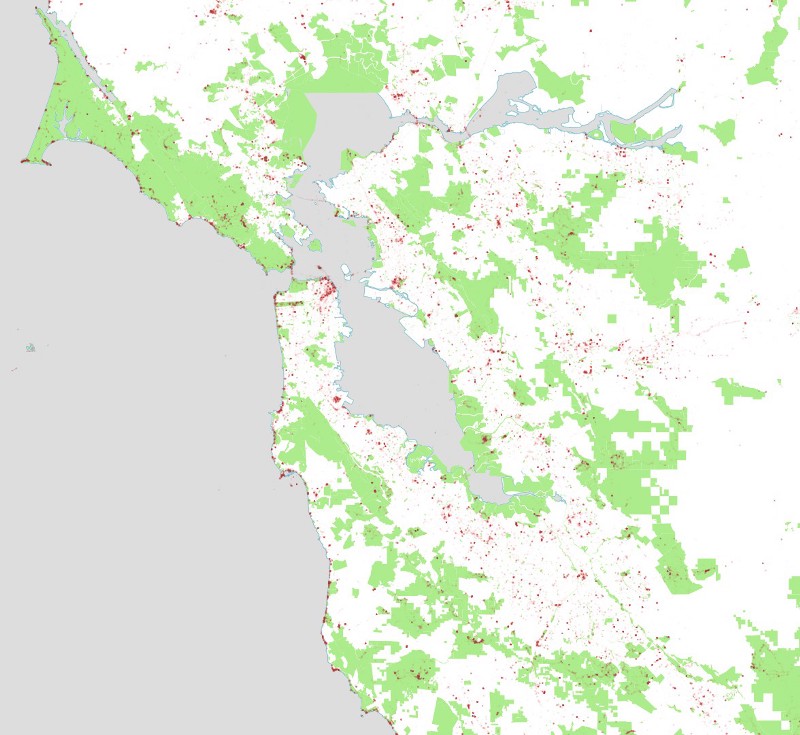
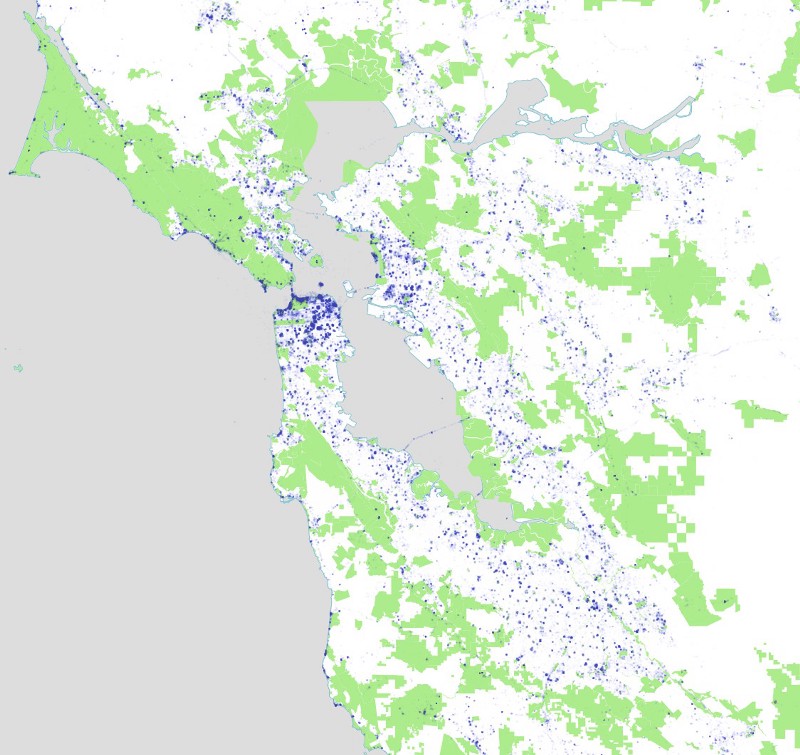
And tweets in San Francisco:
Flickr
Unlike with Twitter, for the other three social media services (Flickr, Foursquare, and Instagram), we found it wasn’t feasible to request all the social media and then filter out what we wanted later. Instead we would need to make multiple requests to grab the photos and checkins for each park.
At first, we tried using the bounding box of each park as our query parameters to the Flickr API. Unfortunately, we quickly figured out this approach wouldn’t work. Because some of the park polygons are large and irregular shapes, those bounding boxes produce a lot of overlap. In fact, for a few of the open spaces, their bounding boxes are as large as California itself (specifically the lands held by theBureau of Land Management and the California Coastal National Monument, which is a thin string of coastline that stretches along the whole coast).
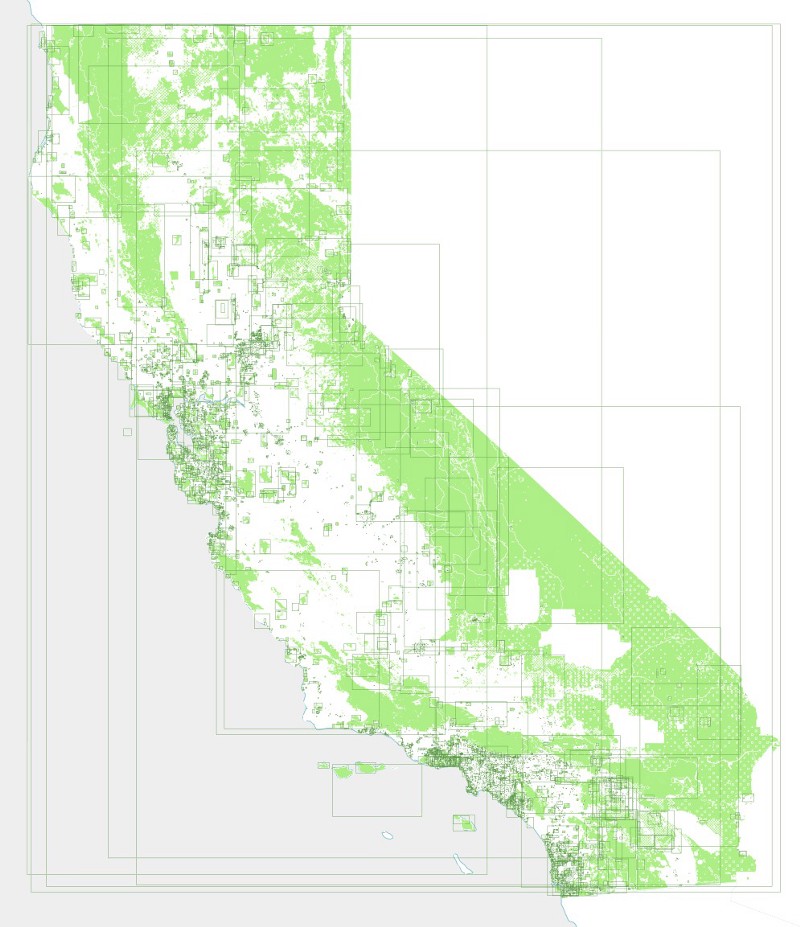
We also want to make our queries as efficient as possible. This not only saves time, but reduces load on the APIs we’re using. We want to be good citizens of the internet and not overload anyone’s servers unnecessarily. So instead, we create a grid of rectangles, each one exactly 1/10th of a degree wide, and use those to query Flickr’s API to prevent any duplication. Before querying, we also check to confirm that each rectangle intersects at least one of our parks. If it doesn’t intersect a park, we will end up throwing away all the returned photos anyway, so why bother querying in the first place?
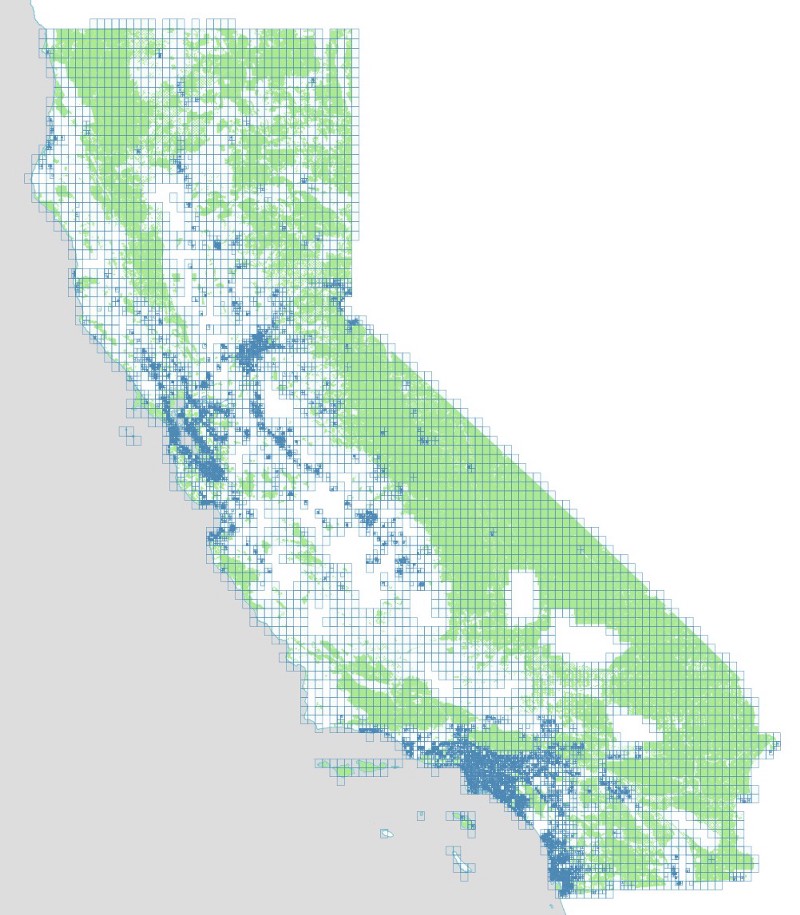
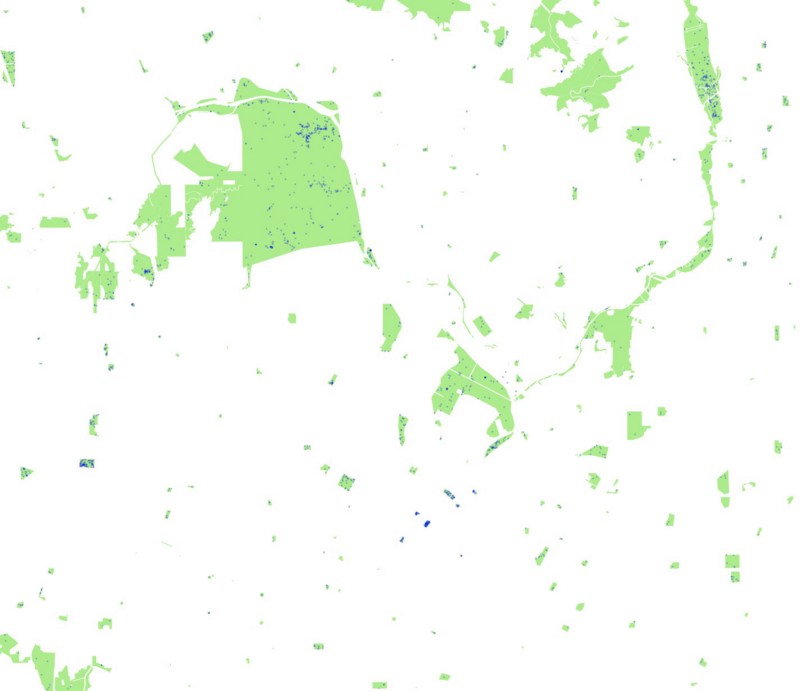
This map shows the query grid, with each rectangle colored according to the number of parks it intersects.
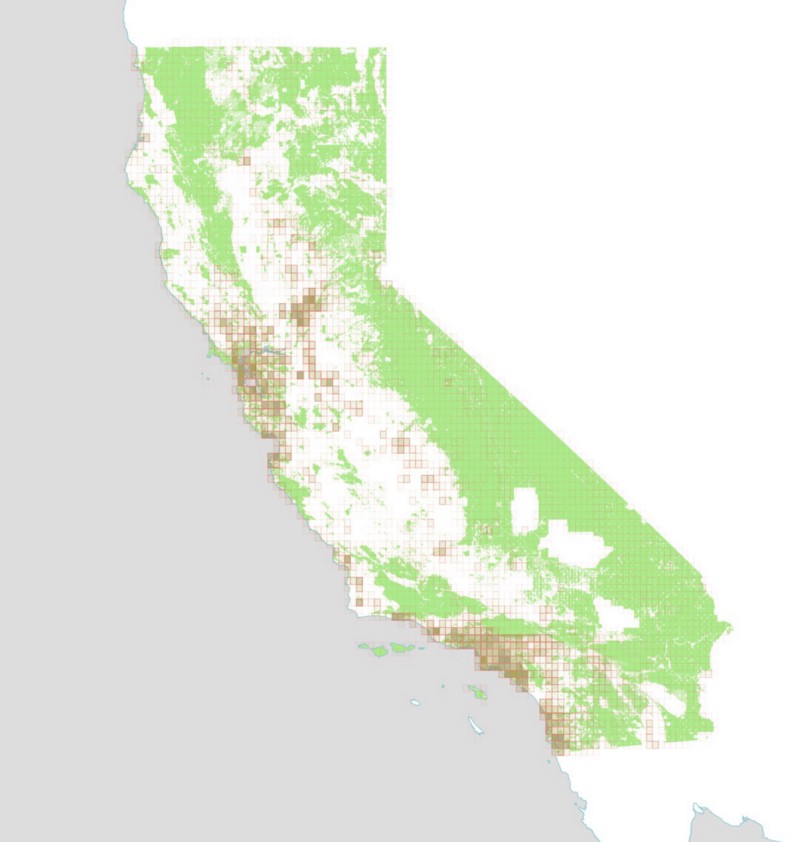
And here is what that grid looks like after querying Flickr, with each rectangle colored according to how many photos were retrieved for that bounding box. Please note that some of these screenshots show the algorithm while it’s in the middle of processing data, which explains why it looks like there are no photos found in downtown Los Angeles.
The locations of the Flickr photos themselves look like this:
Foursquare
For Foursquare, we need to query their API to find the locations of venues in each park. Once we have the information about the venues, we use a separate API query to check the number of checkins at each of those venues. In this way we only have to do the spatial query occasionally, whenever we want to check if new venues have been created (which doesn’t happen very often).
We query Foursquare using the same grid of 1/10th of a degree rectangles that we used for Flickr. However, Foursquare’s API differs from Flickr’s in one important way: each bounding box query returns at most 50 venues. If more than 50 venues exist in a given bounding box, we need to use smaller queries to find them. In order to do this, we keep subdividing our bounding box until the queries return less than 50 venues (which is the only way we know we got them all). We also check to see if our subdivided bounding boxes still intersect parks. If they don’t, there’s no need to proceed with that particular box.
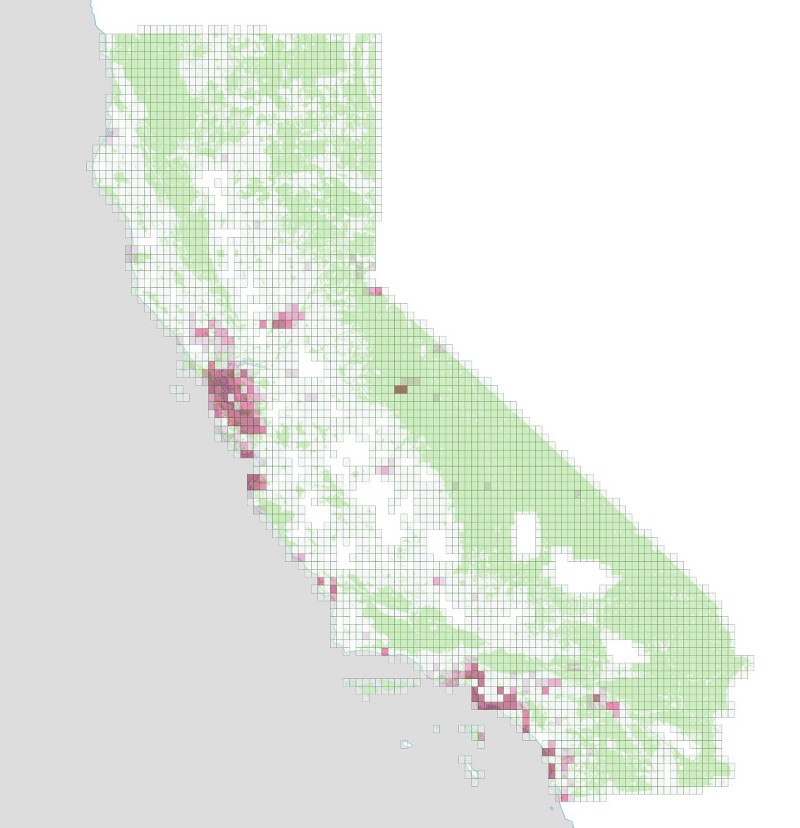
Here is what those subdivided bounding boxes look like:
And here are all the foursquare venues we gathered from those queries:
San Francisco:
Los Angeles:
Griffith Park:
Finally, for Instagram we followed a similar approach, but with yet another twist: Instagram’s API differs from all the others in that it requires a center point and a radius for its spatial query, instead of a bounding box. Because of this, we can’t use the same grid of rectangles that we used for the other APIs. We have to create something new.
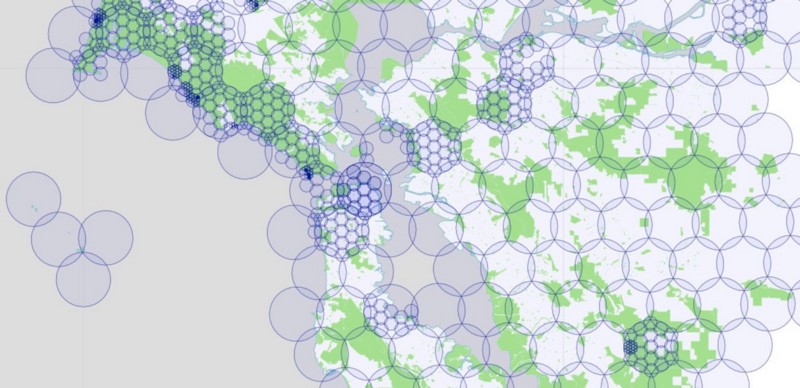
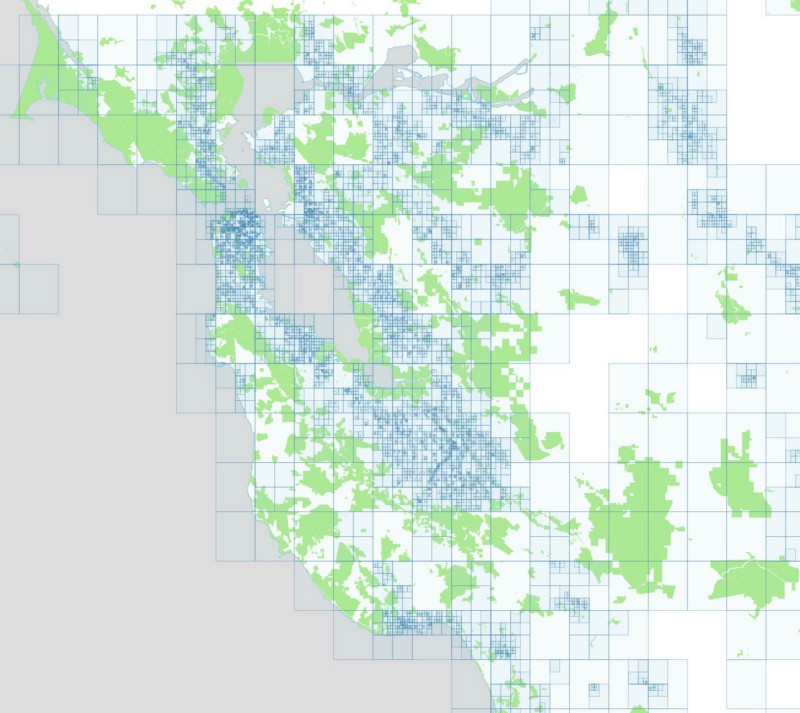
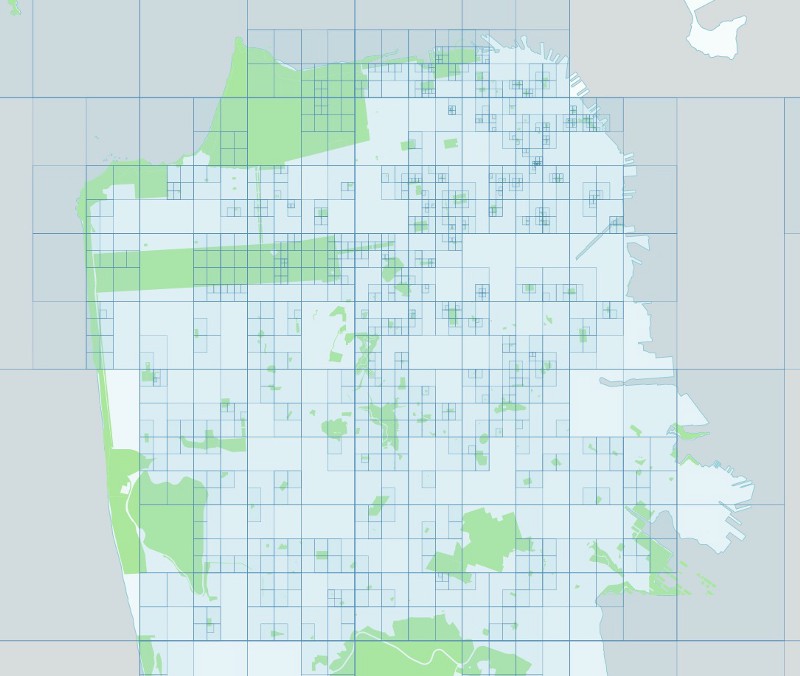
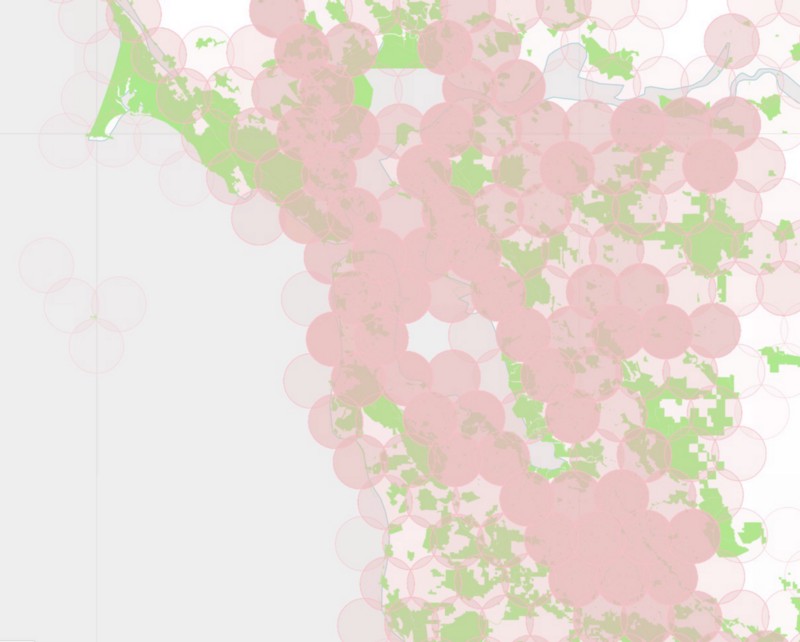
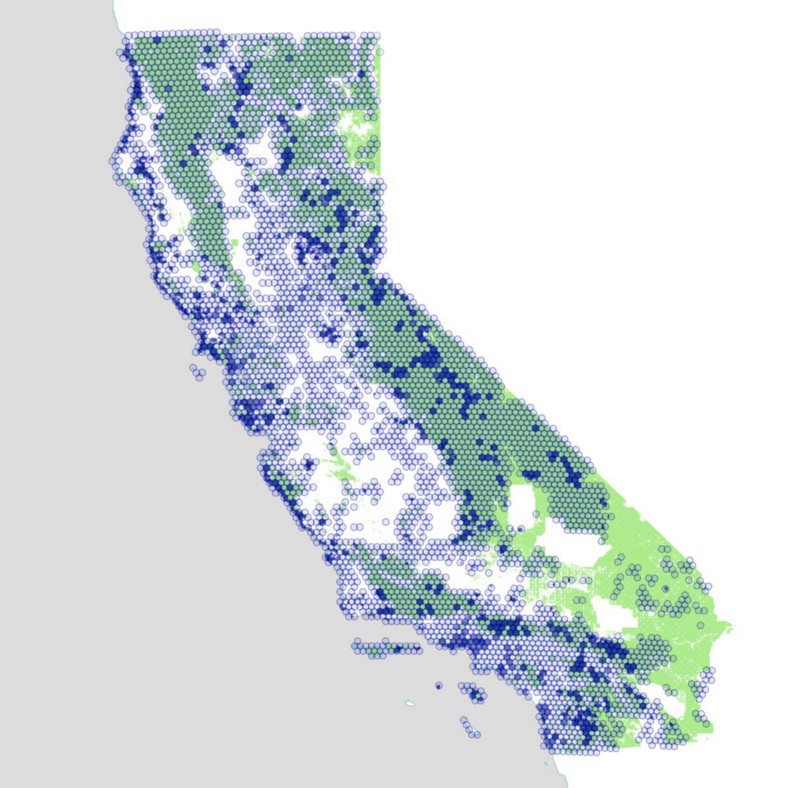
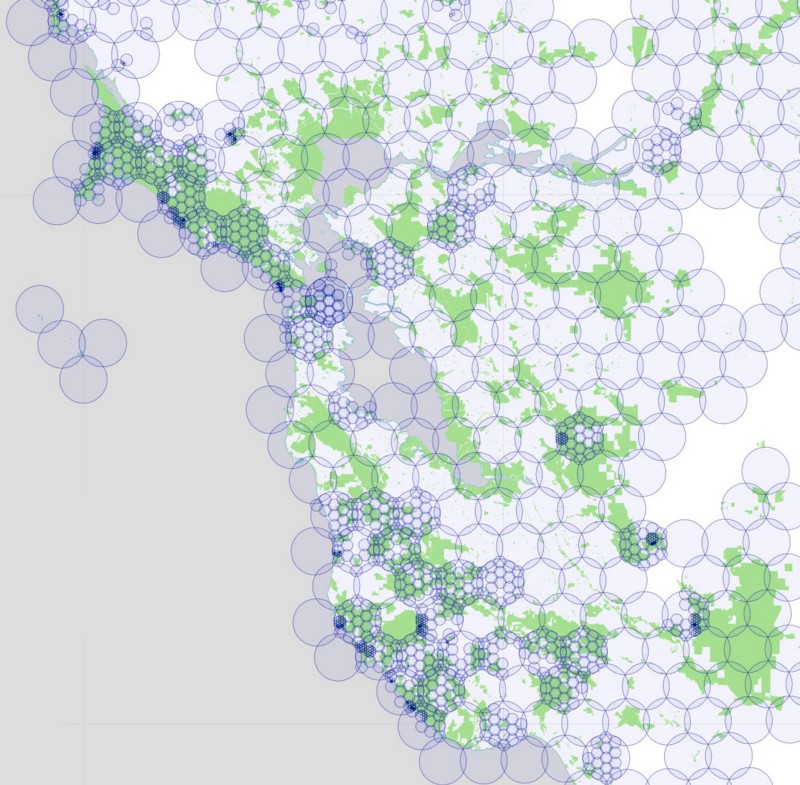
We began by creating a hexagonal grid of overlapping circles, using the maximum radius allowed by Instagram’s API: 5000 meters. Like we did with our rectangles, we blanket California with these circles, but only keep those circles that intersect parks. Here’s a map showing those circles over the Bay Area, colored according to the number of parks that fall within each circle:
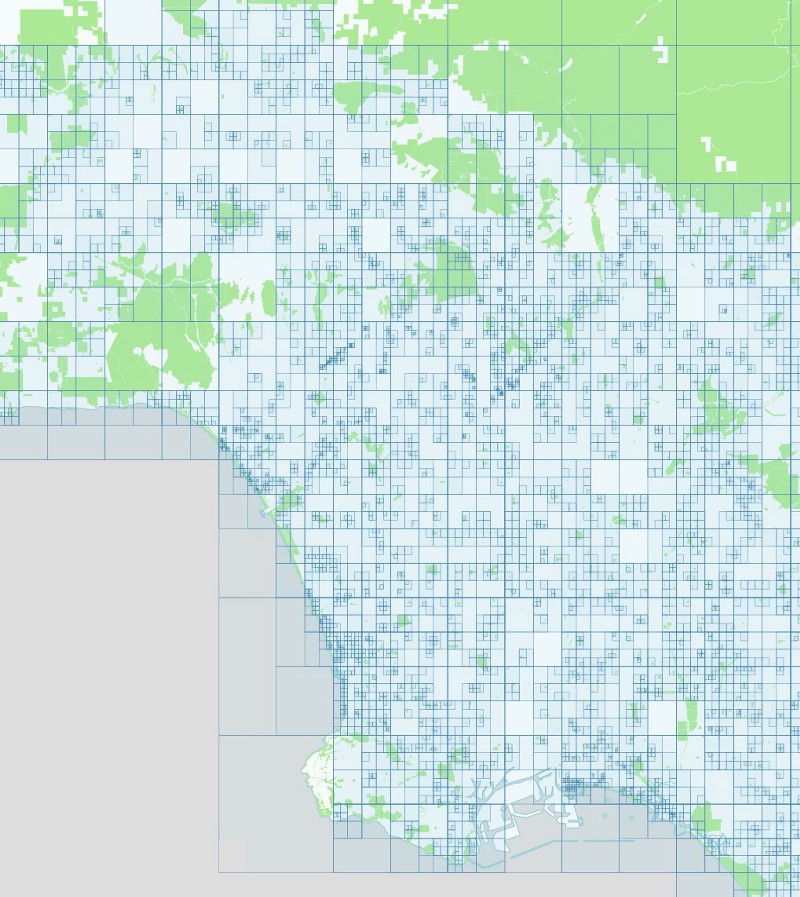
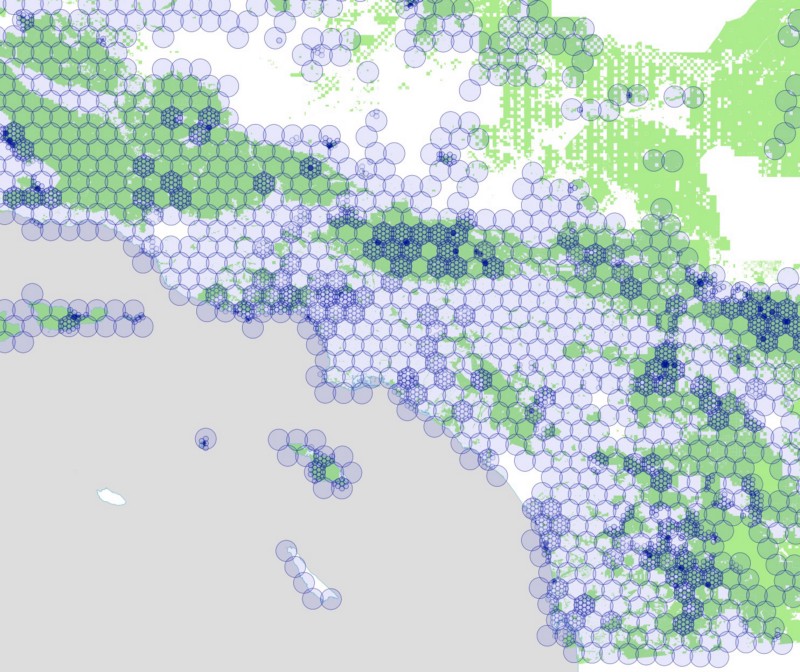
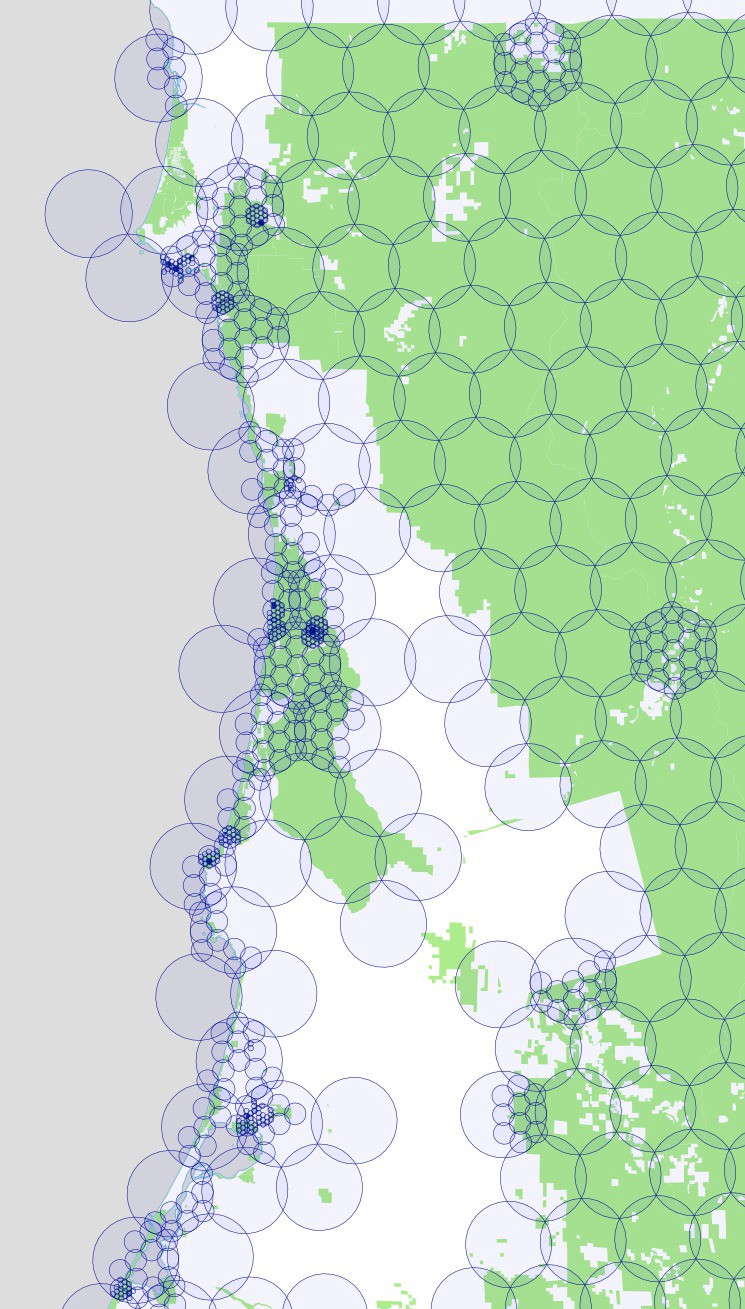
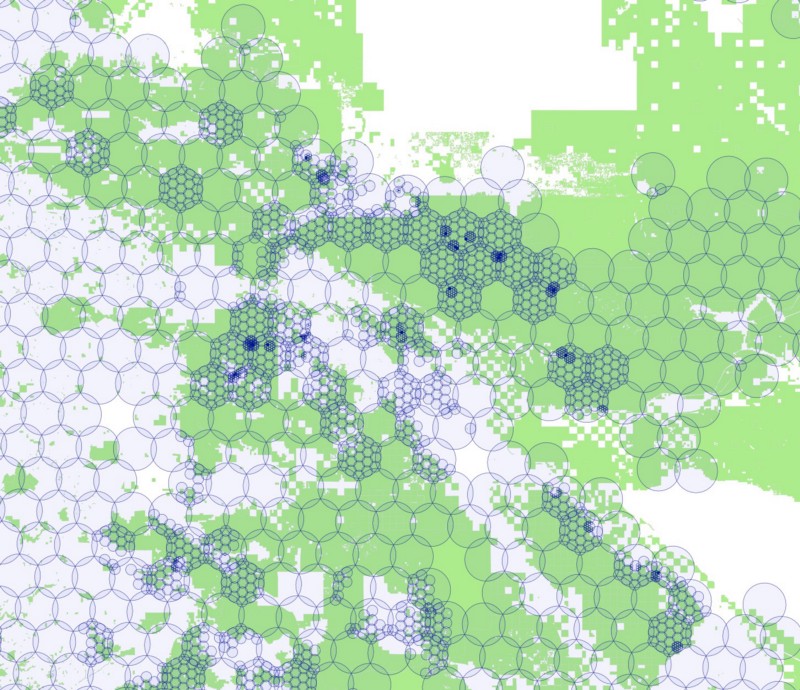
To further complicate matters, the Instagram API behaves like the Foursquare API in that there is a maximum number of photos returned for each query. We found that we could never get more than 100 photos in response to our queries, so we had to use the same subdividing trick we used for Foursquare. If the Instagram API returns exactly 100 photos, we assume there are probably more than that, and subdivide that circle into 19 smaller circles. We test each of these new circles to make sure they still intersect with one of our parks, and if so, we query again, subdividing further and further as necessary.
The results look like this:
For the Bay Area
For Los Angeles
For Redwood National Park
For Joshua Tree National Park
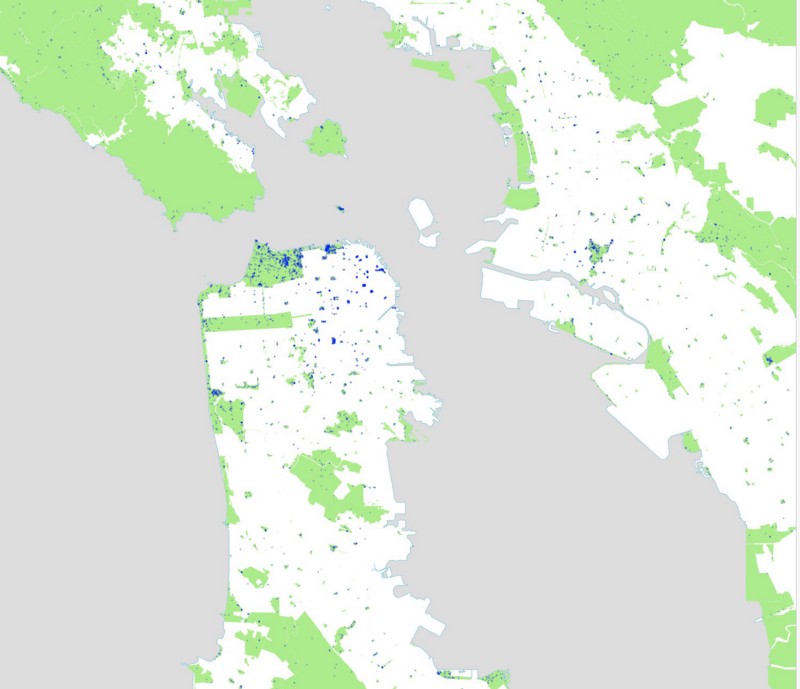
And here are the Instagram photos we harvested in this way:
Remember that these are not all instagram photos, merely all of the ones we grabbed in the process of collecting photos in parks. Notice the interesting fuzzy effects around some of the urban parks, where we captured a lot of photos near parks due to our algorithm of constantly subdividing circles. Most of these photos will be discarded once we intersect them with the precise outlines of our parks and find out they aren’t actually inside a park, simply nearby to one.
There’s a lot more we could do with these techniques, and many more ways we could continue mapping and analyzing these rich datasets. We are actively looking for more partners who can help us further this work. Get in touch if you think you or your organization can help!
We also have plans to open source all of this code in the near future. Stay tuned to the Stamen github repository for updates.