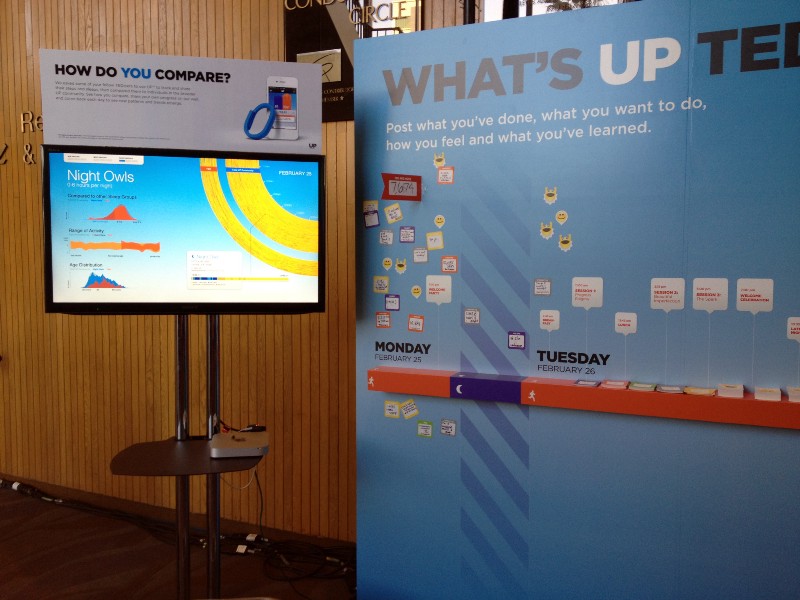
We put together some experimental visualizations earlier this year for quantified self device hot shots Jawbone, showing the behavior of several hundred TED attendees during this year’s conference in Monterey. We worked with their data team to gather up the activity that each of the devices send back to the service, and after carefully combing through to make sure that we respected people’s privacy, combined them into a single visualization that updated throughout the conference and represented the collective behavior of this self-selecting cohort.
One thing you can immediately pick out is that there are patterns in the behavior of people as they filter in and out of sessions; similar to the way traffic snarls move backwards along a freeway, but in reverse. People trickle in to the starts of talks over about a ten minute period, and you can see that quite clearly, and then stand up en masse as the talk ends and they filter out into the halls.
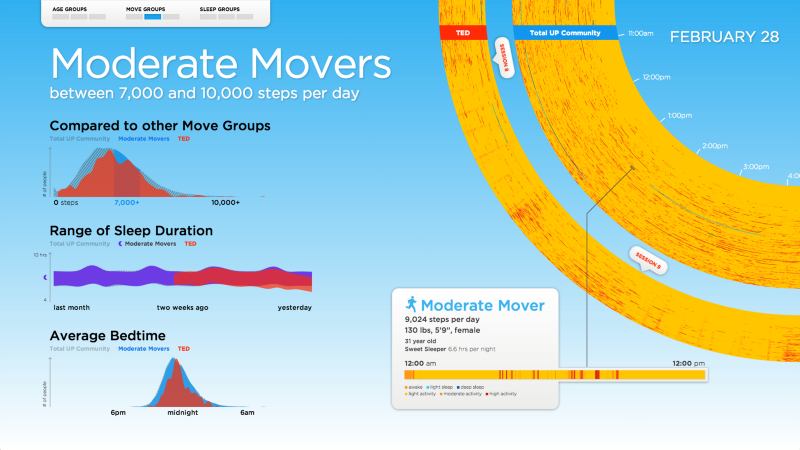
As usual, we started from the data instead of comps, and very quickly hit on the idea of a ring of people’s days, organized by when they wake up. Red is awake, blue is asleep, and each ring is a day. The closer to the center you are, the earlier you wake up:
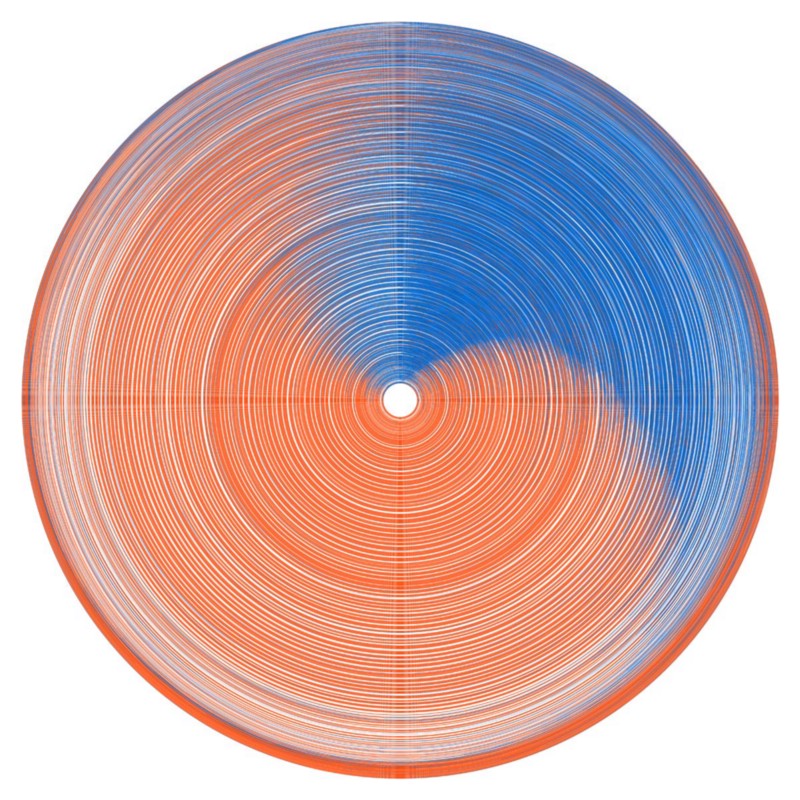
Looking at the edge of waking makes it clear that for lots of people, the passage from sleep to waking is far from linear — this is why lots of these lines turn from red to blue, and back again:
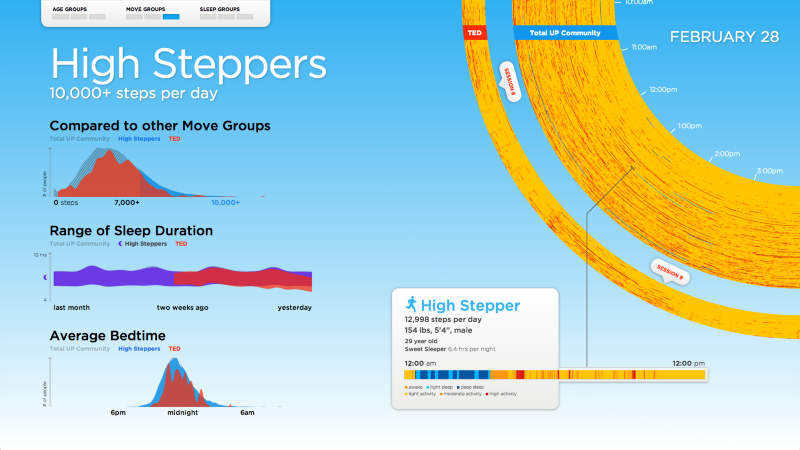
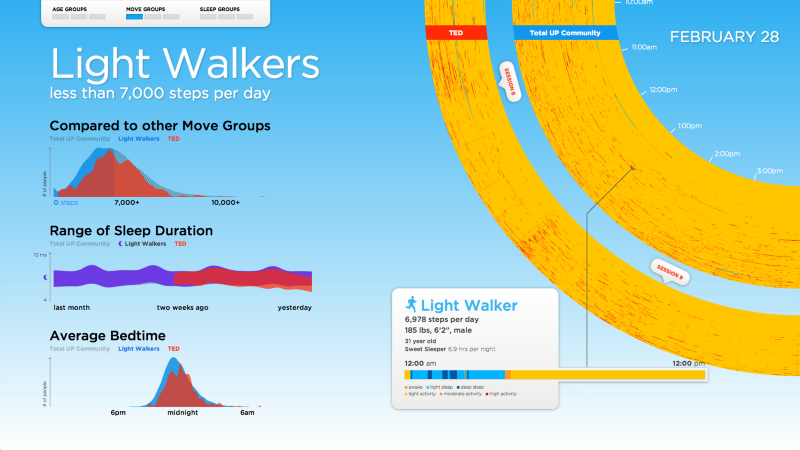
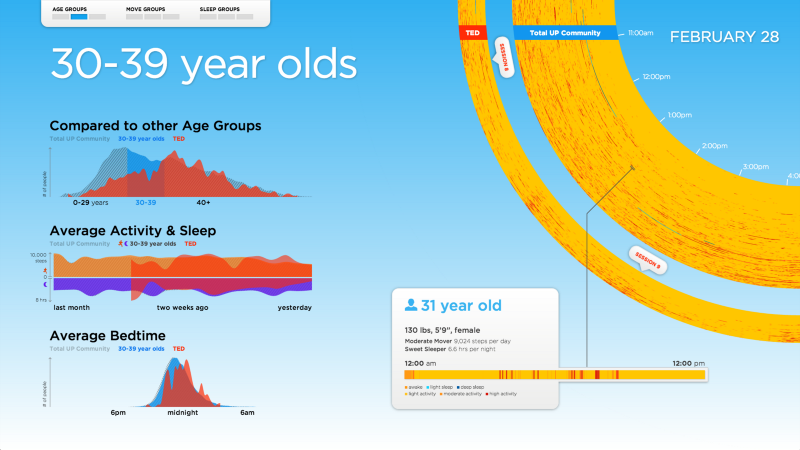
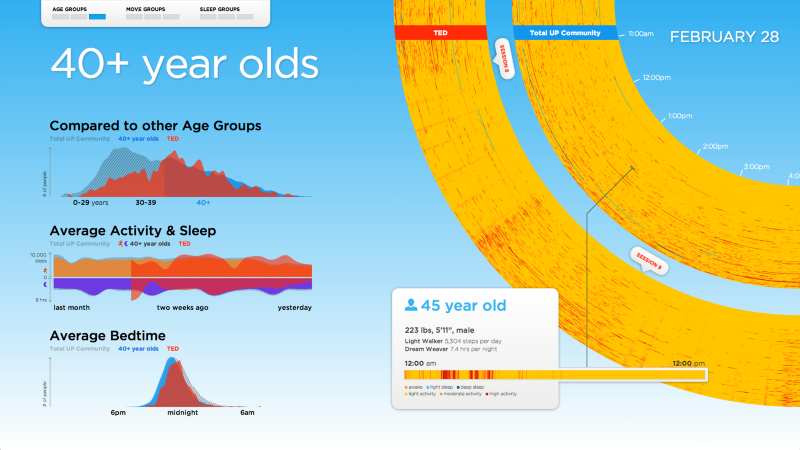
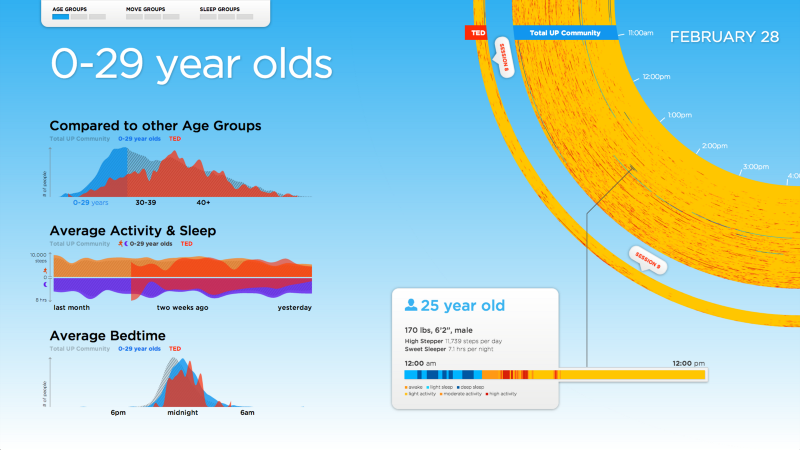
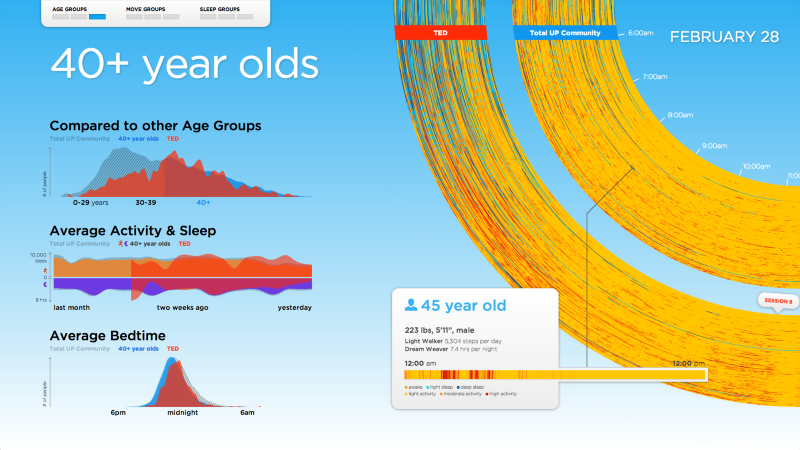
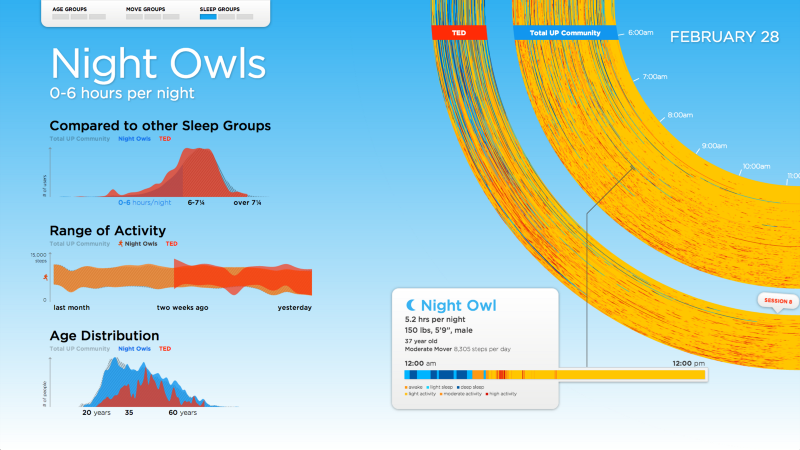
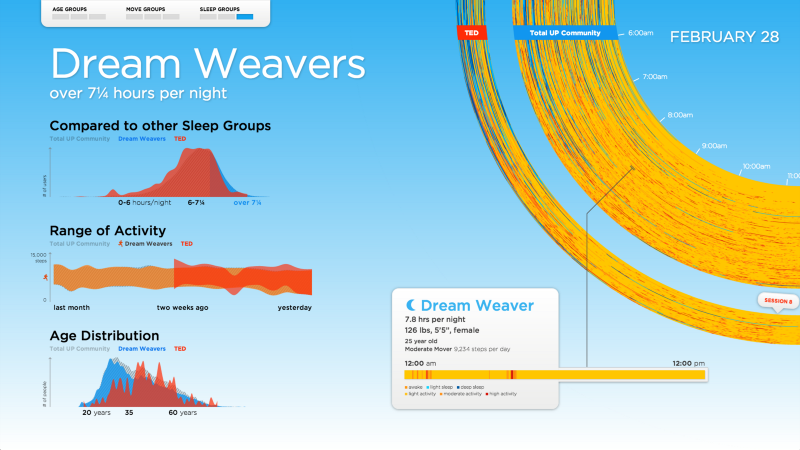
We broke the TED audience into a variety of cohorts: light sleepers, heavy walkers, 40+ and so on, and designed an interface to let attendees switch between them to get a better sense of their activity, both individually and collectively.