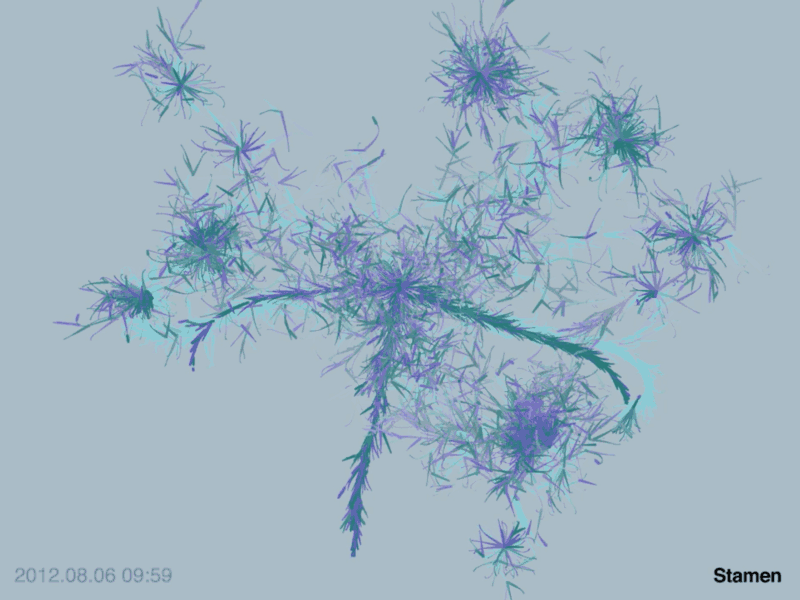
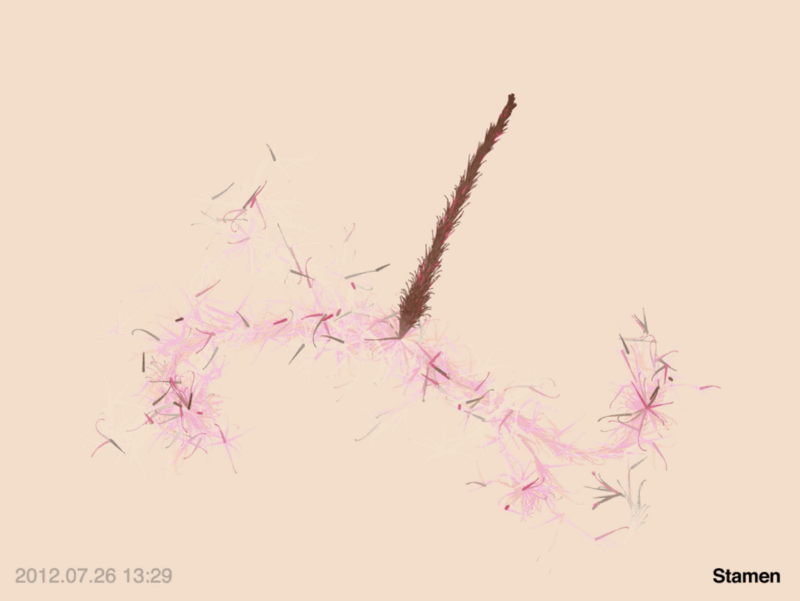
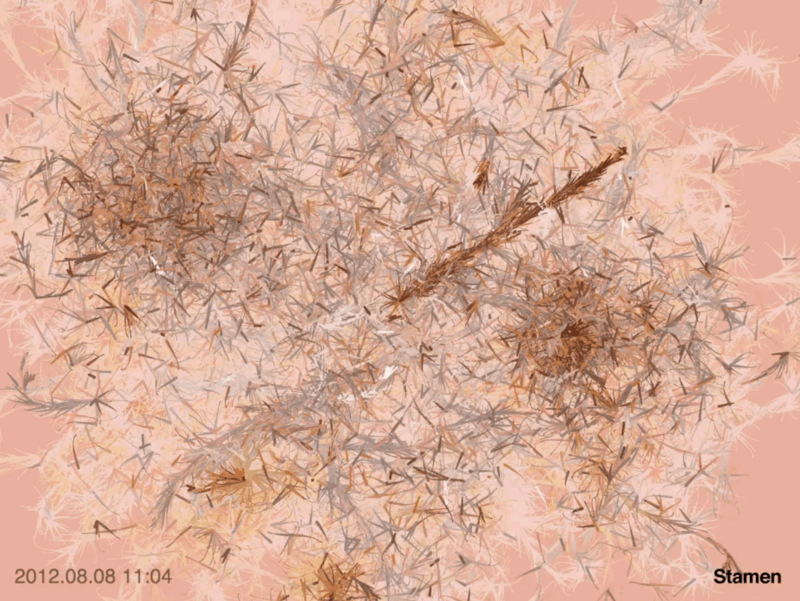
Following up on last month’s map of the world’s friendships on Facebook, we’ve released another visualization of relationships across social networks today. Called “Photo-sharing Explosions,” these visualizations look at the different ways that photos shared on George Takei’s Facebook page go viral once he’s posted them.
Each visualization is made up of a series of branches, starting from George. As each branch grows, re-shares split off onto their own arcs. Sometimes, these re-shares spawn a new generation of re-shares, and sometimes they explode in short-lived bursts of activity. The two different colors show gender, and each successive generation becomes lighter as time goes by. And the curves are just for snazz.
The visualizations are live at facebookstories.com.