
Outside our own kitchens, gas leaks aren’t something we’d ever thought much about here at Stamen. But being a studio filled with progressive San Francisco do-gooders and all, we do think about climate change and sustainability. We also think an inordinate amount about all the sensors out in the world gathering data — satellites, airplanes, cellphones, Jawbones, and, of course, those Google Street View cars.
Last spring, we learned from the Environmental Defense Fund (EDF) that those cars are doing a bit more than taking photos of businesses and tigers wandering through parking lots. Some of them are also measuring natural gas leaks and tracking the impact those links might have on climate change.
Stamen worked with EDF and Google Earth Outreach to design and build a system that EDF staff could use to crunch complex data files used by scientists into easily digestible maps that give an immediate sense of the scale of leaks in various cities around the country. For now, the maps cover only Boston, Indianapolis, and Staten Island, but Google will keep gathering data in more cities and the system we built for EDF allows them to easily add more maps as more cities come online.
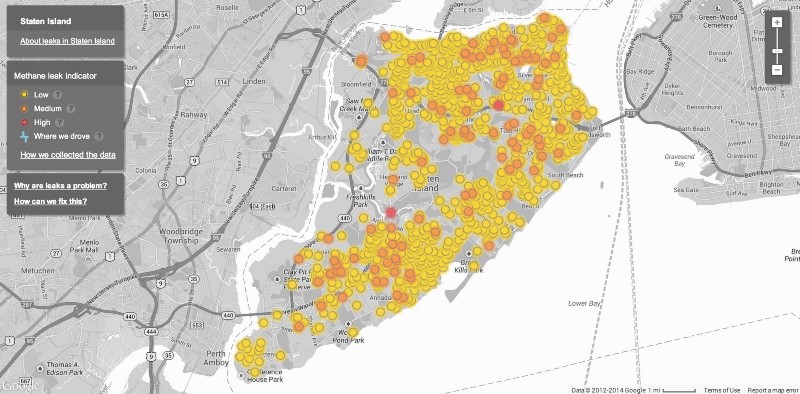
Here’s New York, which is totally covered in methane leak occurrences:
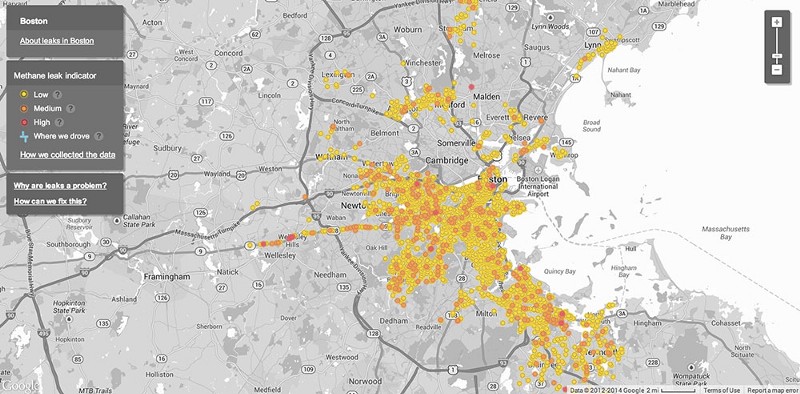
As is Boston:
You might ask, is this normal? Well, take a look at Indianapolis:
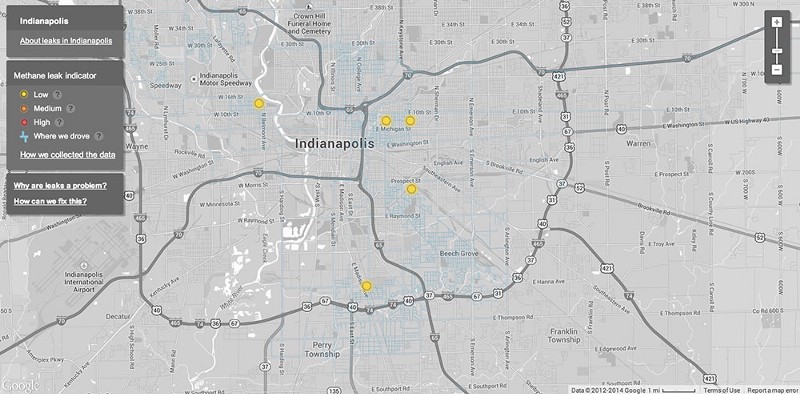
There’s a lot less going on.
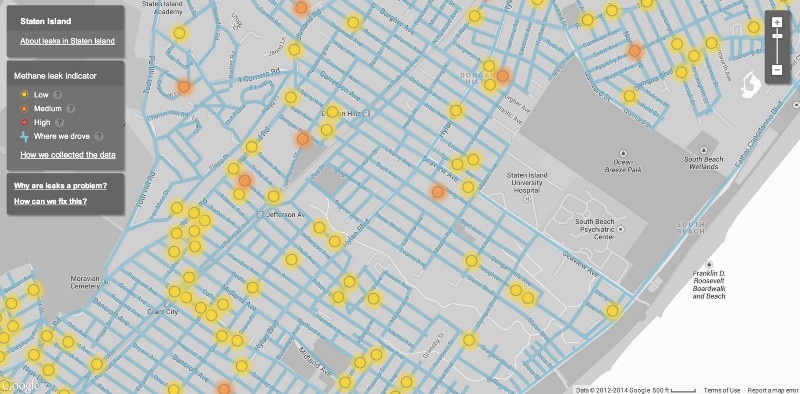
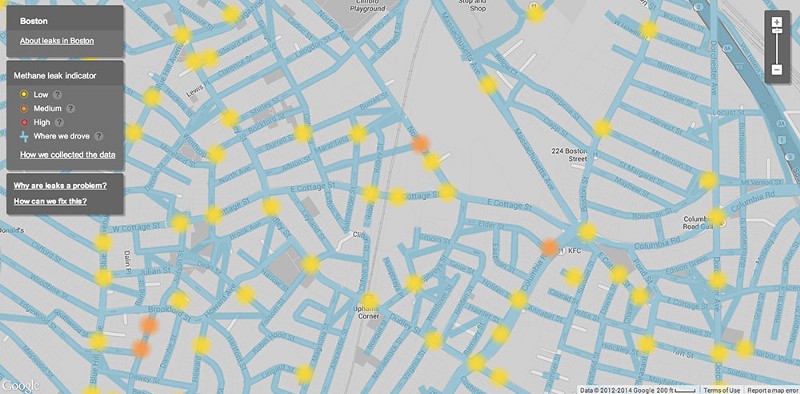
It was important to EDF and Google that we show the paths the cars drove, as well as the leaks detected, since the absence of leaks could mean sound pipes, or just an area that hadn’t yet been sampled. We took our cue from the familiar blue lines of Google Street View maps to show the drive paths, and then desaturated the base map to make sure the focus stayed on the leaks and sample areas.
Among our design goals for the project was to balance the visual presentation against the nature of the data. The leaks detected are really something called “verified peaks” — elevated methane levels detected frequently enough and at high enough levels to be significant. But, given winds and the potential for leaks to be contained in buildings and a thousand other variables, a measured peak doesn’t necessarily mean there’s a leak at an exact location out to n-decimals of latitude and longitude. So we opted for larger dots and diffuse edges.
And all these leaks are much lower than anything that would cause your neighborhood to erupt in flames. So the overall palette is a bit muted — nothing’s going to explode!
But our vast natural gas system — from wells getting drilled across the county to the networks of pipes in our cities to the knob on your kitchen stove — does make a huge difference for the future of our climate. We’re delighted to have helped EDF and Google begin mapping the part of that infrastructure that most closely touches tens of millions of people across the country.