
Earlier this year we worked with Warner Bros. to create an interactive map called Quarantine Your City on which fans of the latest Oren Peli thriller, Chernobyl Diaries, could vote to see a special screening in their city. The plot follows a group of modern-day American tourists on an “adventure tour” of Pripyat, the site of the infamous nuclear catastropheat the Chernobyl Nuclear Power plant on April 26, 1986. As you can probably imagine, things don’t go quite as planned.
Radiation Levels
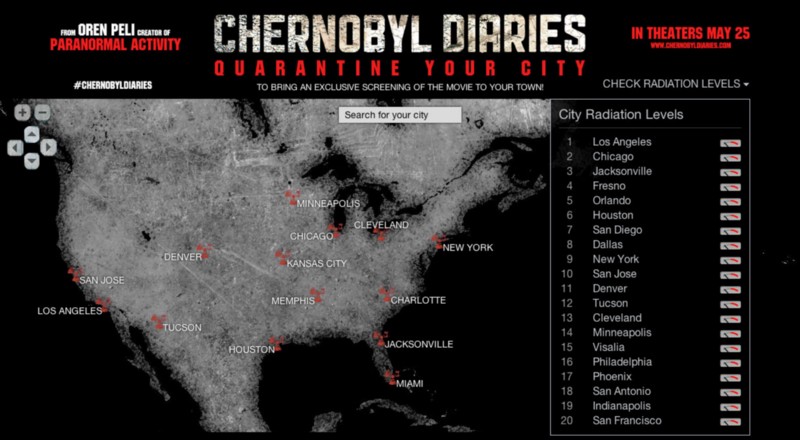
The idea behind the screening competition was that users could “quarantine” their city by voting for it on Twitter or Facebook, which would raise the radiation levels over a certain threshold, and after a couple of weeks would Warner Bros. select the 20 most popular. Here’s what it looked like early on:
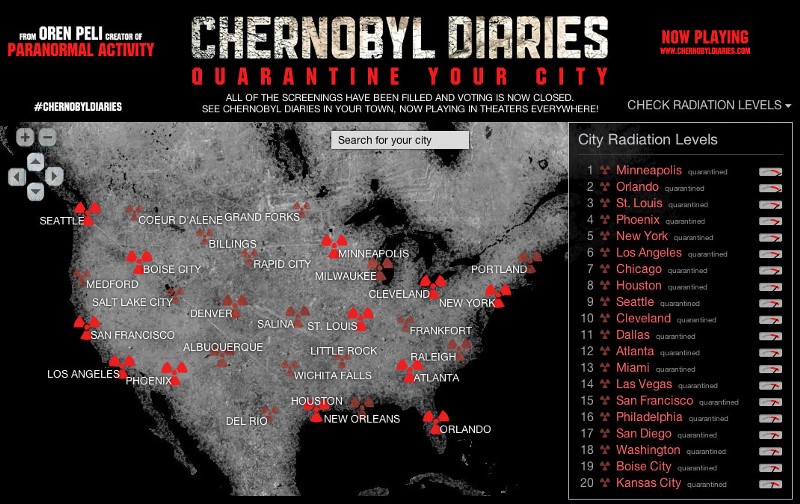
And after the voting was done:
We used ModestMaps and Easey to build this map. One significant improvement we made over the PA3 map was to squeeze all of the label positioning information for the most populated US cities into a single data file, which makes the whole map feel much more responsive when zooming in and out. We even used image sprite to pack all of the different radiation symbol sizes and color combinations into a single image. Browsers are getting faster by the day, and it’s not hard to imagine a near future when we could put a hundred times as many labels as this on a slippy map:
Cartography
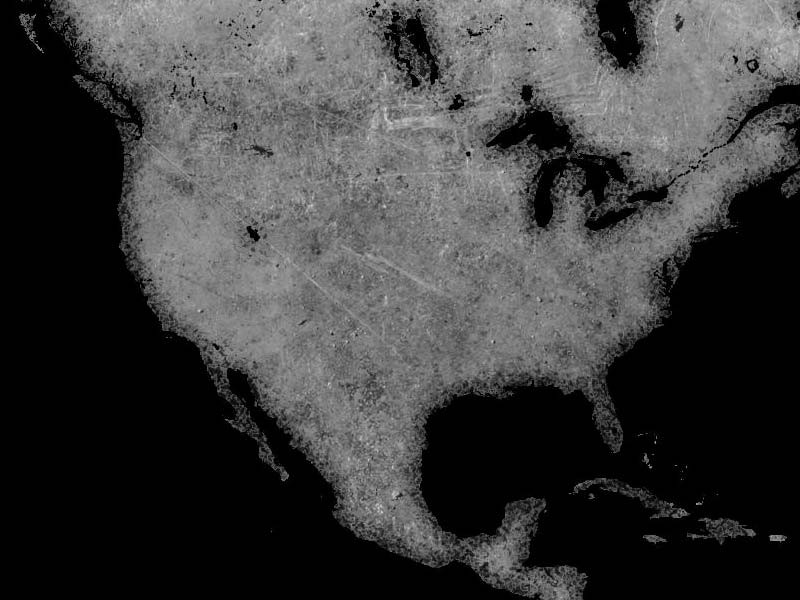
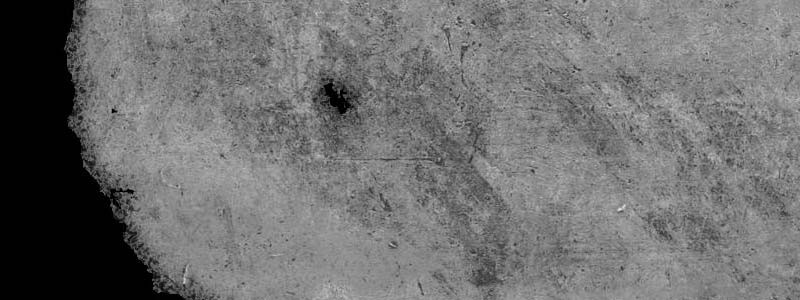
Drawing inspiration from the rusted metal and concrete textures used in the film’s advertising materials, and using the same process that we developed for our watercolor maps, Zach and Geraldine created a new map in which land masses are rendered as hunks of crusty, mottled concrete.
Check out the standalone slippy map, or click on the images below.
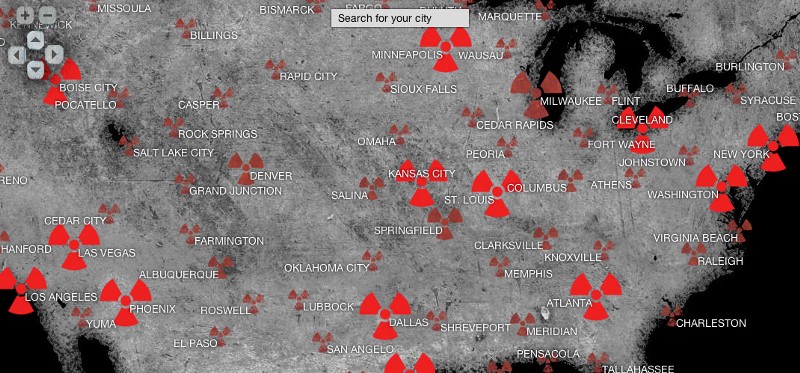
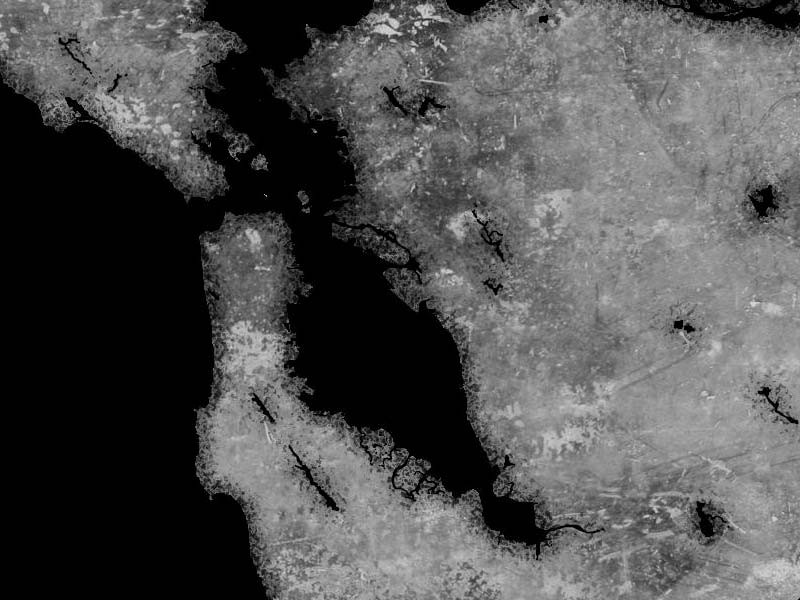
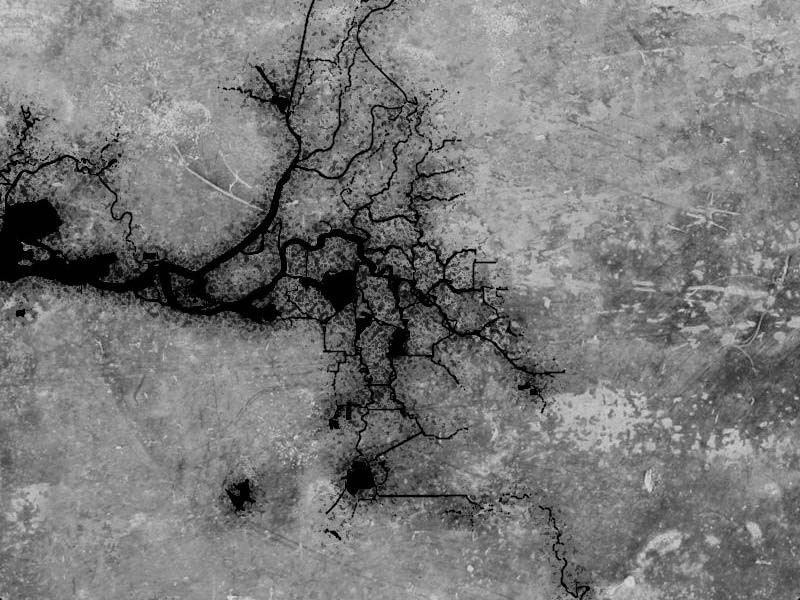
The texture changes subtly at each zoom level, getting more messed up and contrasty as you go in:
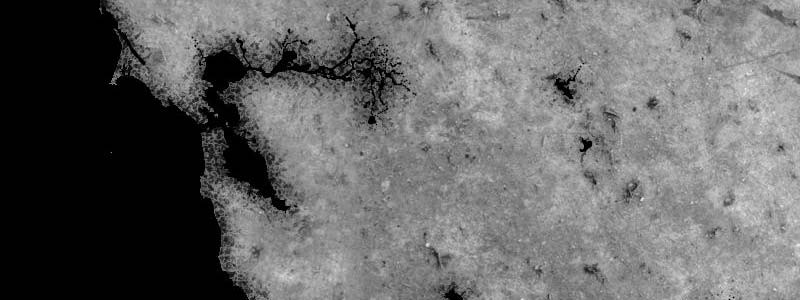
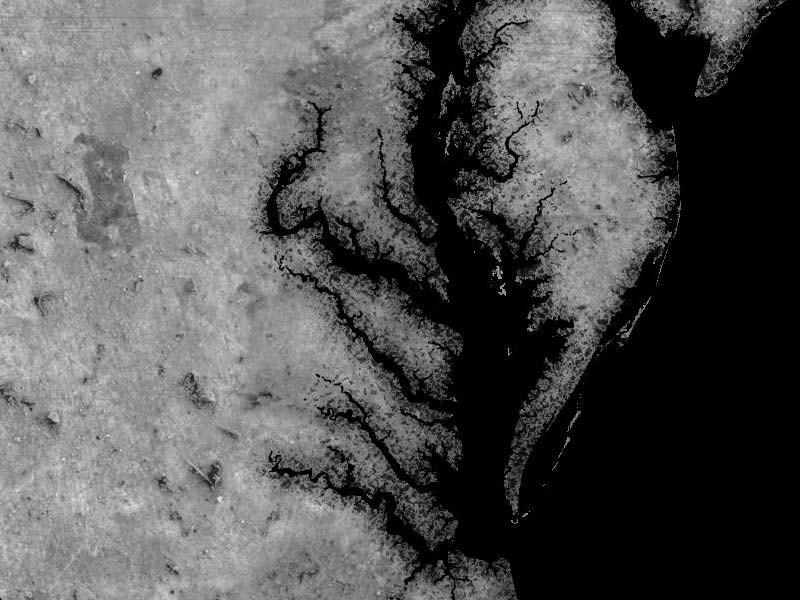
The coastline treatment gets really interesting around places like the San Joaquin River delta and the Chesapeake Bay:
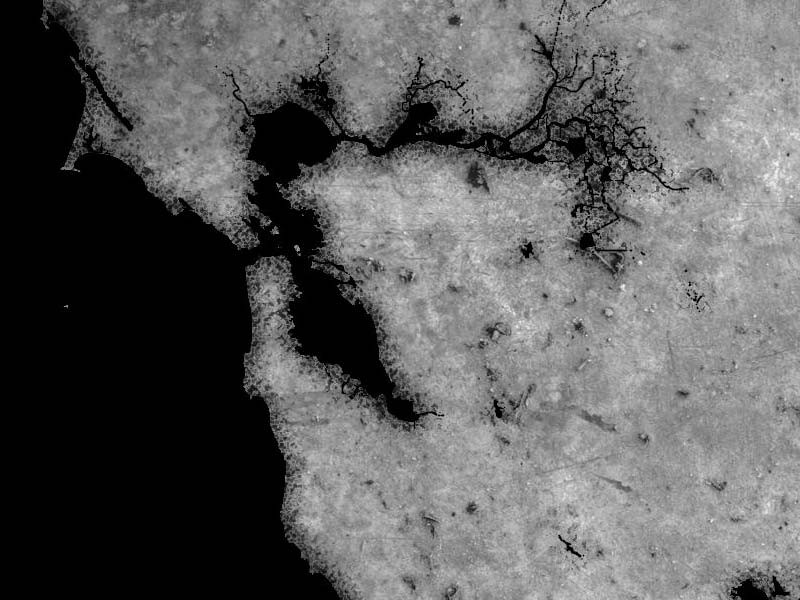
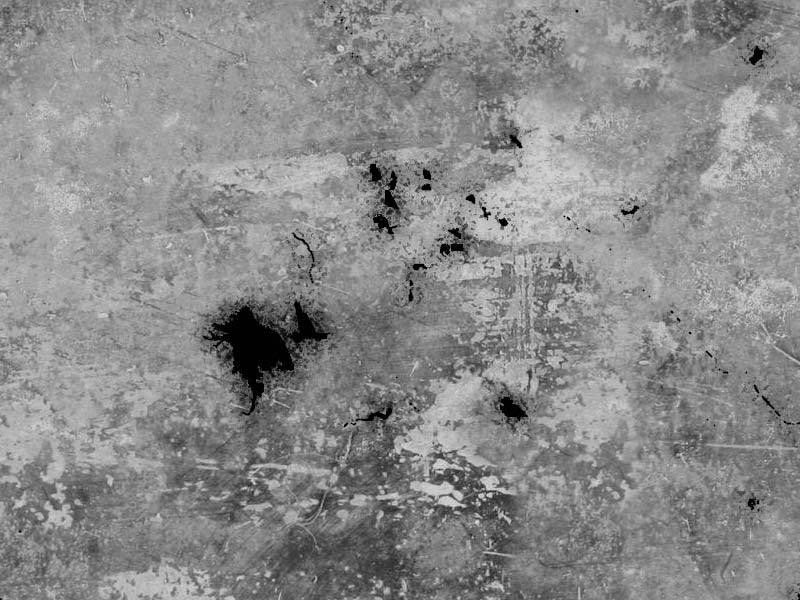
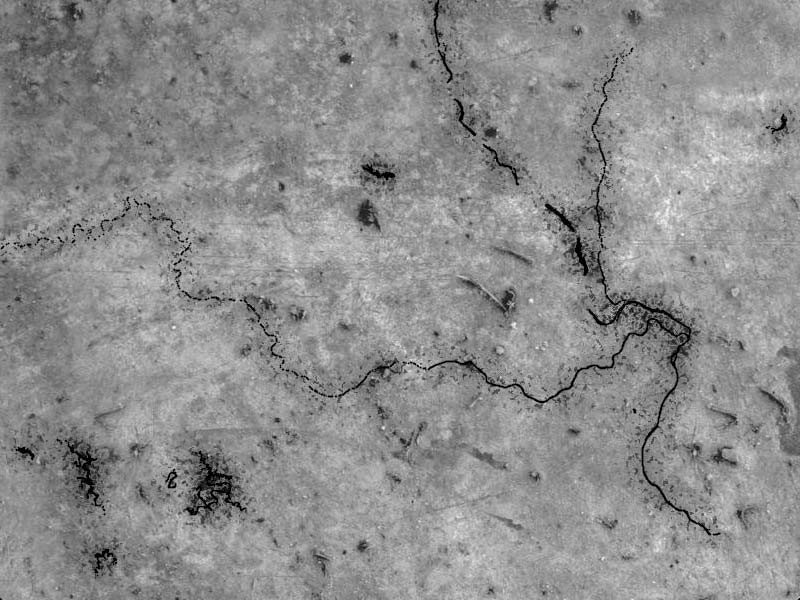
And inland lakes and rivers look more like craters, cuts, fissures and scars:

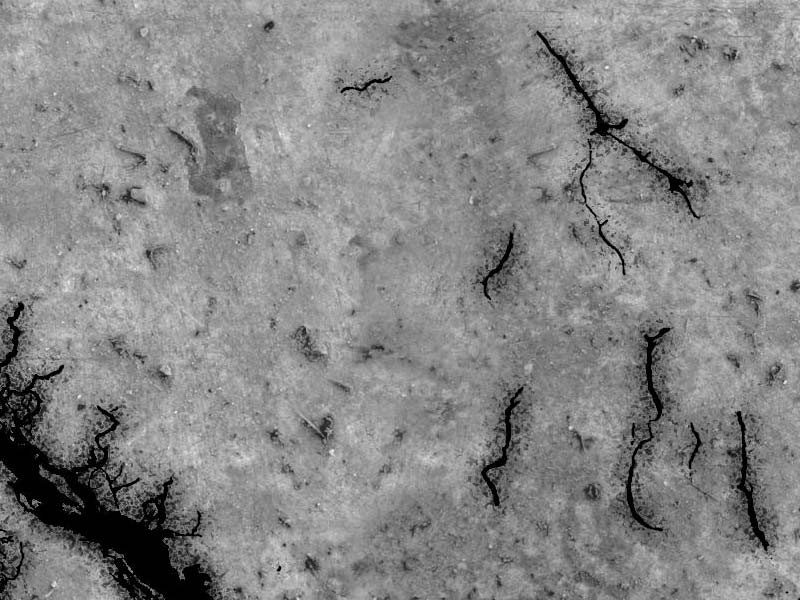
We’re obviously having a lot of fun pushing the boundaries of what’s possible with online cartography, and we’re getting better and faster at making worldwide maps in the process. If you’re looking to get your own maps of the world, and especially if you’re looking for maps that look like they’ve been attacked by a horde of radioactive zombies, do get in touch!