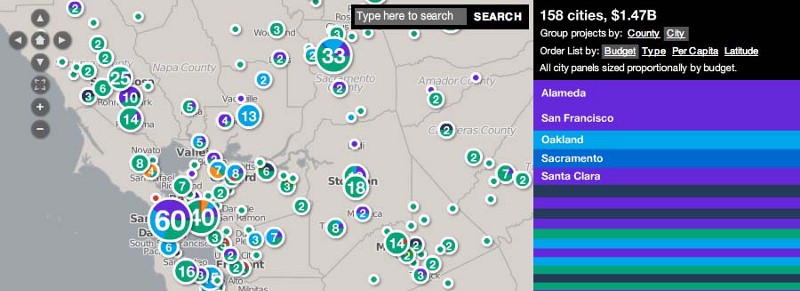
The State of California launched our most recent project today, a closer look at the $5.6 billion in Federal Stimulus funds that the State has received so far. There’s alot there and I hope you’ll go play with it yourself but the main thing I want to say is that you can slice and dice it all kinds of different ways and it’s just slick as hell.
And this one is from a little while ago, but I didn’t blog it when it came out — a live visualization of activity between computers for LogMeIn, whose recent successful IPO is leading some to speculate that perhaps all is not lost.
Both of these projects were headed up by Sha Hwang (whose bio I’m still waiting for) who’s been doing some really great work at Stamen since he started about a year ago.
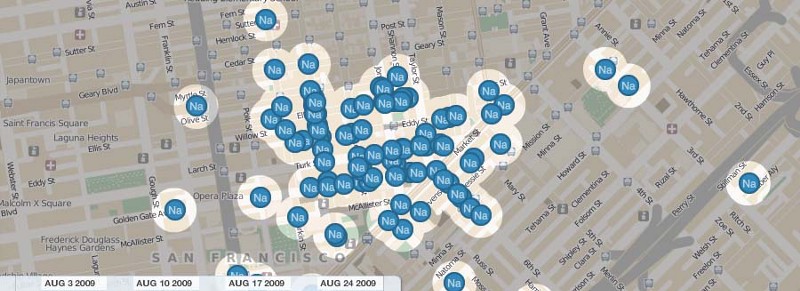
In local news, there’s been a huge sting operation in San Francisco’s Tenderloin aimed at reducing crime in one of the city’s most troubled neighborhoods, which has apparently reduced things like property crime in the neighborhood dramatically. Since we’ve got access to the city’s crime data for the dates of the sting, it should be interesting over the next few weeks to see how the map changes in response to this effort.