
The California Healthcare Foundation (CHCF) released an update to their “All Over The Map” survey of elective surgery and other procedure rates across the country yesterday. Funded by CHCF, this research is designed to help Californians understand their local healthcare region performs against the California average. Stamen worked with the CHCF a second time on this project, taking the opportunity to update the first version built in Flash into HTML5 & JavaScript, including a new Leaflet map of California. (The first version was released in December 2011.)
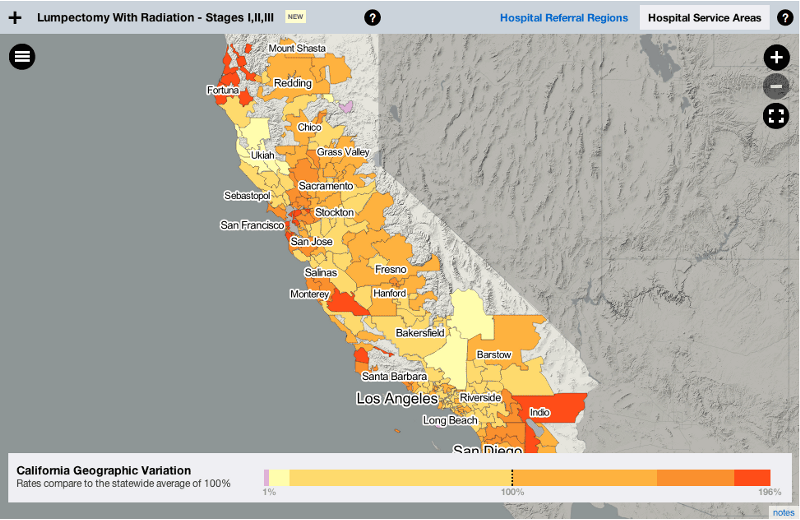
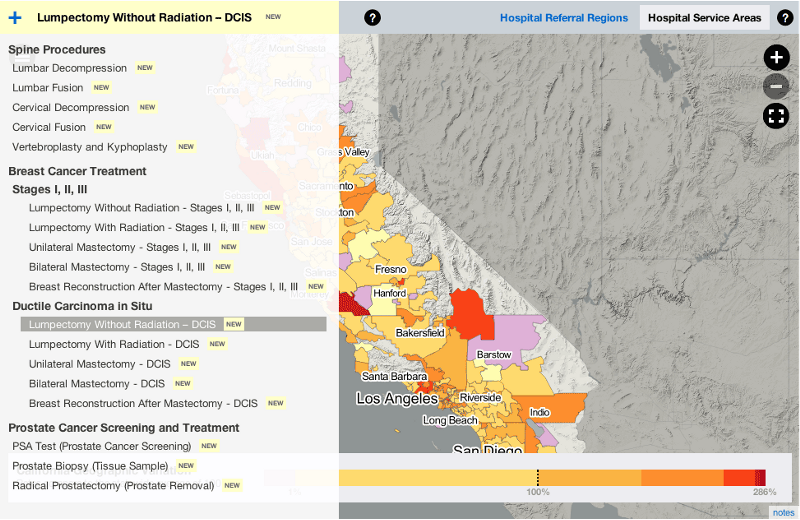
The updated data included several new elective procedures like breast cancer treatment and spinal procedures, which we highlighted in the “menu” of procedures:
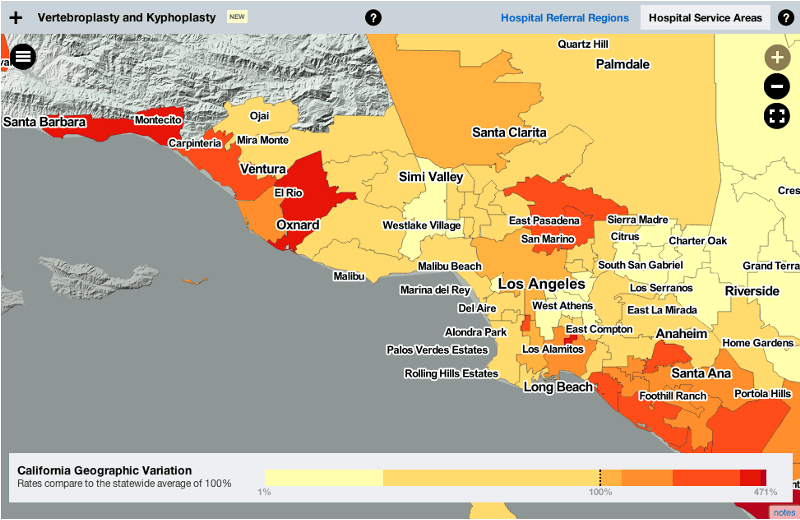
This update also allowed us to make some improvements in the readability of the data, like a dynamically updating graph at the bottom of the map that shows the range of performance per procedure for all the regions currently visible on the map:
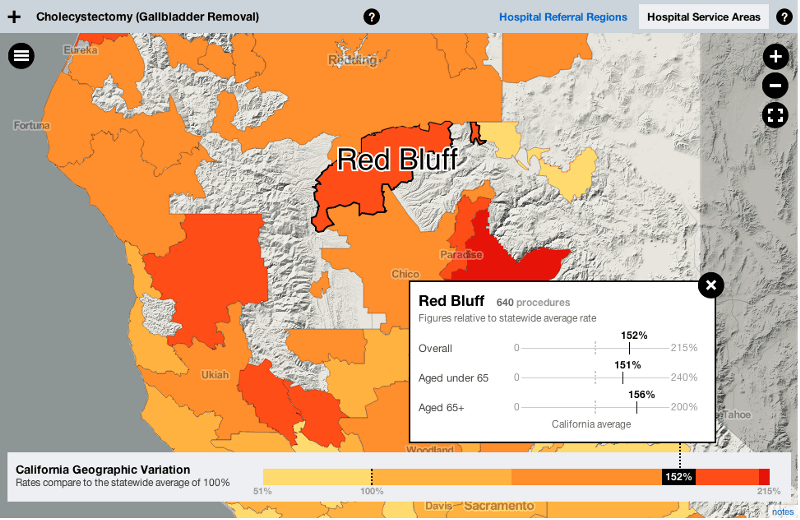
And a new chart per region that allows you to glance at that region’s performance by age relative to the California average, for example, you can see that more gallbladder-ectomies happen in Red Bluff comparative to other regions, in each age group:
It’s always good to have the opportunity to try to improve on work we’ve done before, and we were very pleased to have this opportunity with the folks at CHCF. Making this healthcare-related information more accessible to Californians is important work, and we’re proud to have been involved. The study has made the news too — you can see the press release on Reuters or this article in Silicon Valley’sMercury News.